Surveillance Cities: who has the most CCTV cameras in the world?
2021 was the year when the one-billionth CCTV camera was predicted to be installed. That’s one camera per every eight humans on Earth. But they are not spread out equally. In China and the US, for example, there is already one camera per 4.1 and 4.6 people, respectively. Massive CCTV surveillance directly impacts people's privacy - that’s why Surfshark gathered the numbers, crunched them, and produced a series of new visualizations to illustrate just how pervasive surveillance cameras are in the 130 most populous international cities.
Key Findings
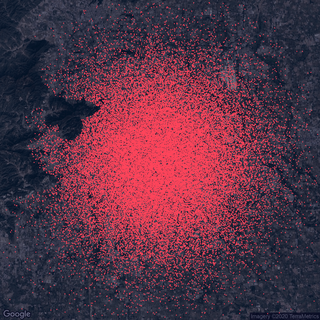
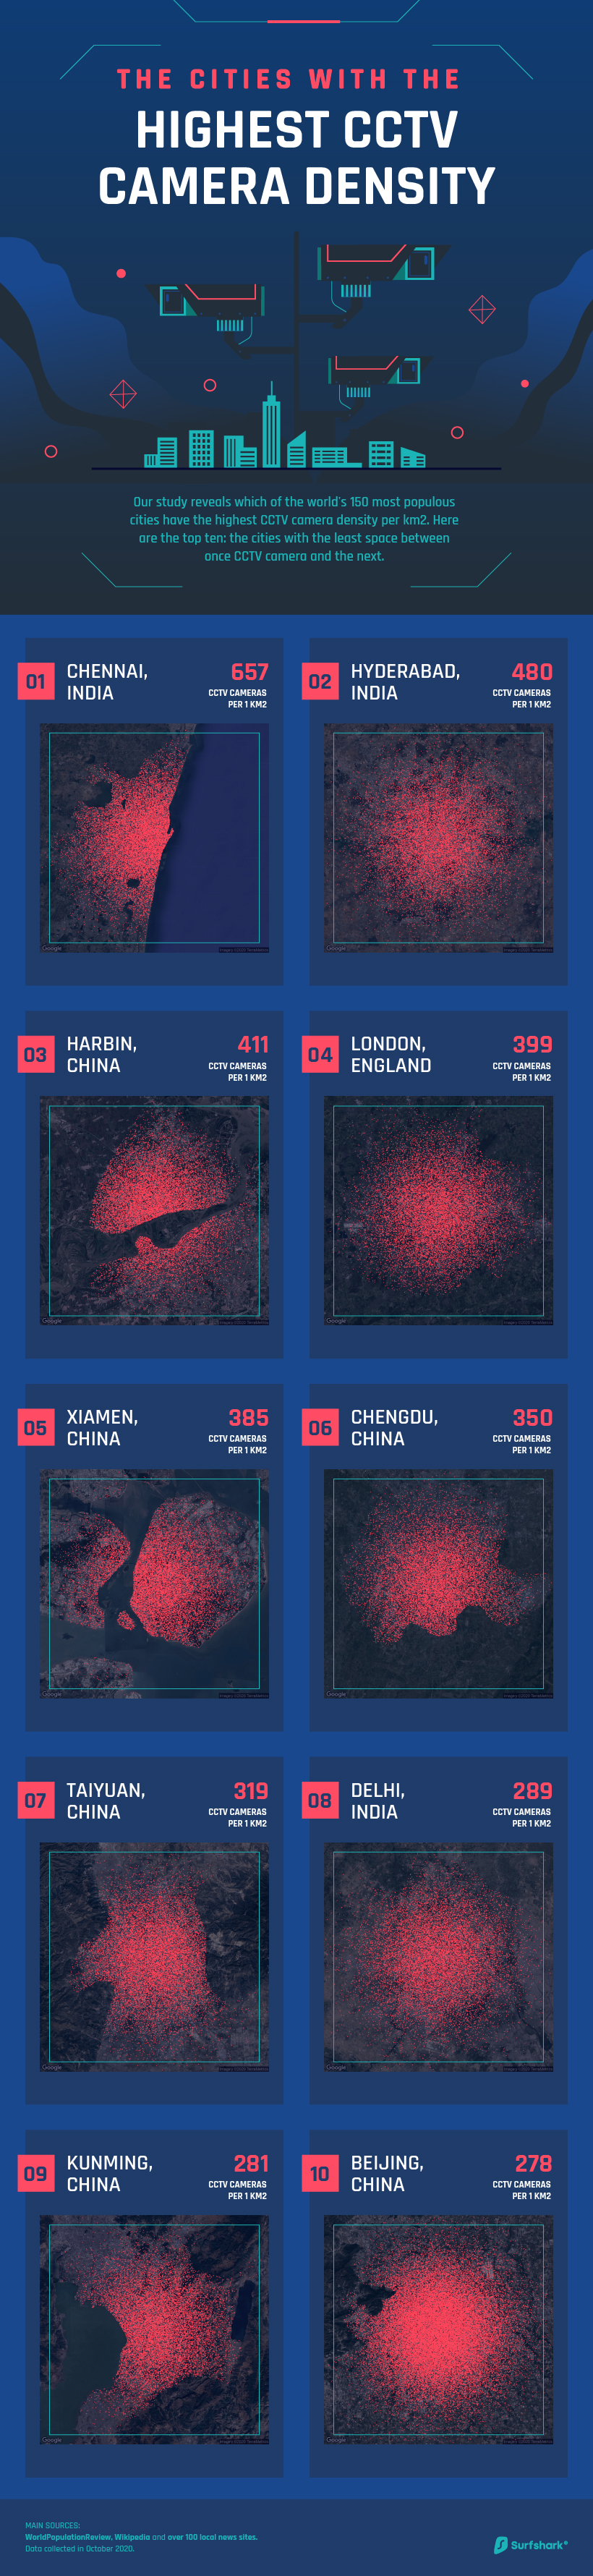
- Chennai in India is the city with the highest density of CCTV cameras: 657.28 per km2.
- London, England, has the most CCTV cameras per km2 outside of Asia: 399.27/km2.
- New York has the highest density of CCTV cameras installed in the US: 25.97/km2.
- Beijing in China has the most cameras (1.15M) but is ranked #10 for density (277.51/km2).
- Six of the top 10 cities with the highest density of CCTV cameras are in China; three are in India.
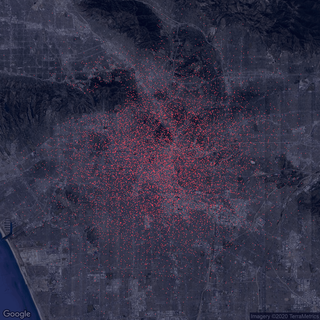
CCTV camera density map in every country in the world
This interactive map illustrates the density of CCTV cameras in the 150 countries in our study. Zoom in to see a more detailed view of each city's cameras, and hover over the dots for more details.
China and India stand out as the countries with the highest-density surveillance cities. Of course, both nations are home to some of the most populous cities worldwide, which is why so many of the 130 “dots” are based there. All the same, Chinese and Indian cities dominate the top 10 for camera density, and Chinese cities continue to dominate the top 30.
On the positive side, China’s pervasive surveillance reassures its public: “Having these cameras everywhere makes me feel safe,”
as one interviewee told TIME. On the other hand, China’s blanket CCTV coverage and its integration of smart systems put citizens at the mercy of
justice-dealing algorithms that “predict” crimes and order preventive arrests. This situation puts CCTV’s opposing themes of “liberty” vs. “security” into stark relief.
Comparing the density of CCTV cameras between cities
Does a higher number of cameras per km2 mean reduced crime rates? Or are they just an intrusion on our privacy? Select a city in each column of this interactive map to compare their surveillance and crime profiles.
It’s a 10,000km trip from Xiamen to London, but both cities have a similar CCTV profile: just under 400 cameras per km2. However, London is in the top third of the table for crime, while the Chinese city of Xiamen is apparently one of the safest cities in our study.
Does CCTV work for fighting crime? That depends on what you want it to do. As one UK report notes, surveillance cameras are very effective at making the population feel safe. Ironically, however, CCTV works better for solving crimes than preventing them. Or, to put it in other words, you’re still as likely to experience the horror of getting robbed at knife-point, but the police may be able to track down the perp better.
The top 10 cities with the most CCTV Cameras per km2
China dominates our study. The world’s most populous country either has an awful lot of people to protect or an issue with control – depending on your take. India is the world’s second-most populous country, and Indian cities occupy three of our top 10 spots. But India doesn’t yet have China’s “smart” surveillance infrastructure or strategy of preemptive arrests. So what is the difference?
“The answer may lie in the way our cities are growing,” writes Vandana Vasudevan, Senior Fellow of the Sustainable Cities and Transport program of the World Resources Institute. Crime is rising along with fiercer competition for urban resources, continues Vasudevan. “The middle class cocoons itself into gated communities and then attempts to protect itself by erecting high walls and a thousand cameras.”
Panopticon Cities of the World
In 1785, social theorist Jeremy Bentham completed his first design for the Panopticon. This prison building was configured so that the guard at the center would always be able to see every prisoner around him. The prisoners would never know who, if anyone, was watching him – so in theory, they’d behave as though being watched, i.e., responsibly! The Panopticon, Bentham claimed, was a “new mode of obtaining power of mind over mind, in a quantity hitherto without example.”
Today the Panopticon has escaped the prison. Surveillance technology now relies on CCTV cameras and tracking every digital trace we leave. While some cities have more blind spots than others, contemporary theorists suggest that we’ve internalized the need to conform to society’s standards. CCTV makes us feel safer and asserts a sense of community responsibility. Is the price – our privacy and the risk of institutional abuse – too much to pay?
Take the first step towards reclaiming your privacy
Navigating the world where you feel watched and tracked 24/7 is difficult. But there are still ways for you to be in control of your online privacy. As your data becomes increasingly more valuable and internet censorship skyrockets globally,
VPNs (Virtual Private Networks) have become popular among regular internet users. A VPN hides your real IP (Internet Protocol) address and encrypts your internet traffic, allowing you to browse the internet in private without being watched or tracked.