Global key insights of DQL 2022
How is your country doing in the Digital Quality of Life Index?
DQL world map
The map shows Digital Quality of Life Index 2022 rankings.

Find one of 117 country profiles
Find country profileCompare up to 4 countries
Compare countries- Global
Global key insights of DQL 2022
How is your country doing in the Digital Quality of Life Index?
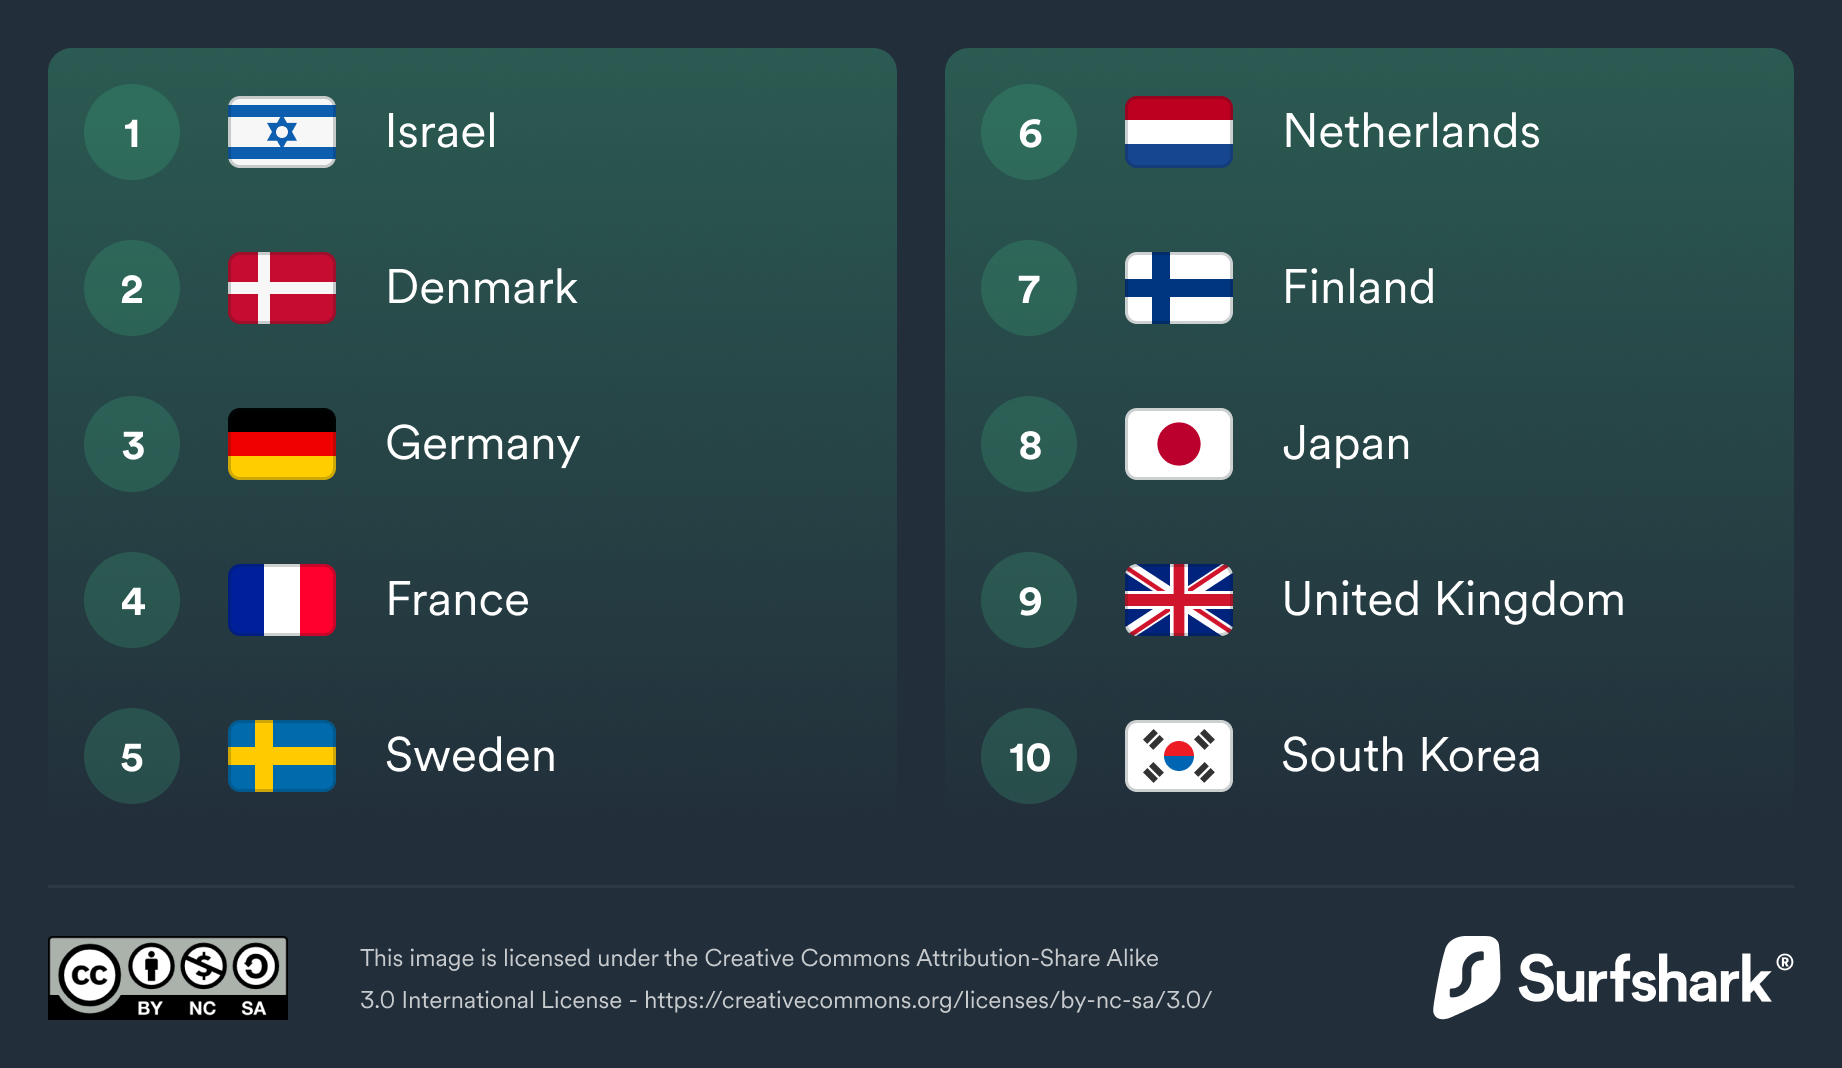
Europe continues to lead in digital quality of life.
7 out of 10 countries with the highest DQL are in Europe with only 18 of the top 50 countries located outside.
- Israel
- Denmark
- Germany
- France
- Sweden
- Netherlands
- Finland
- Japan
- United Kingdom
- South Korea
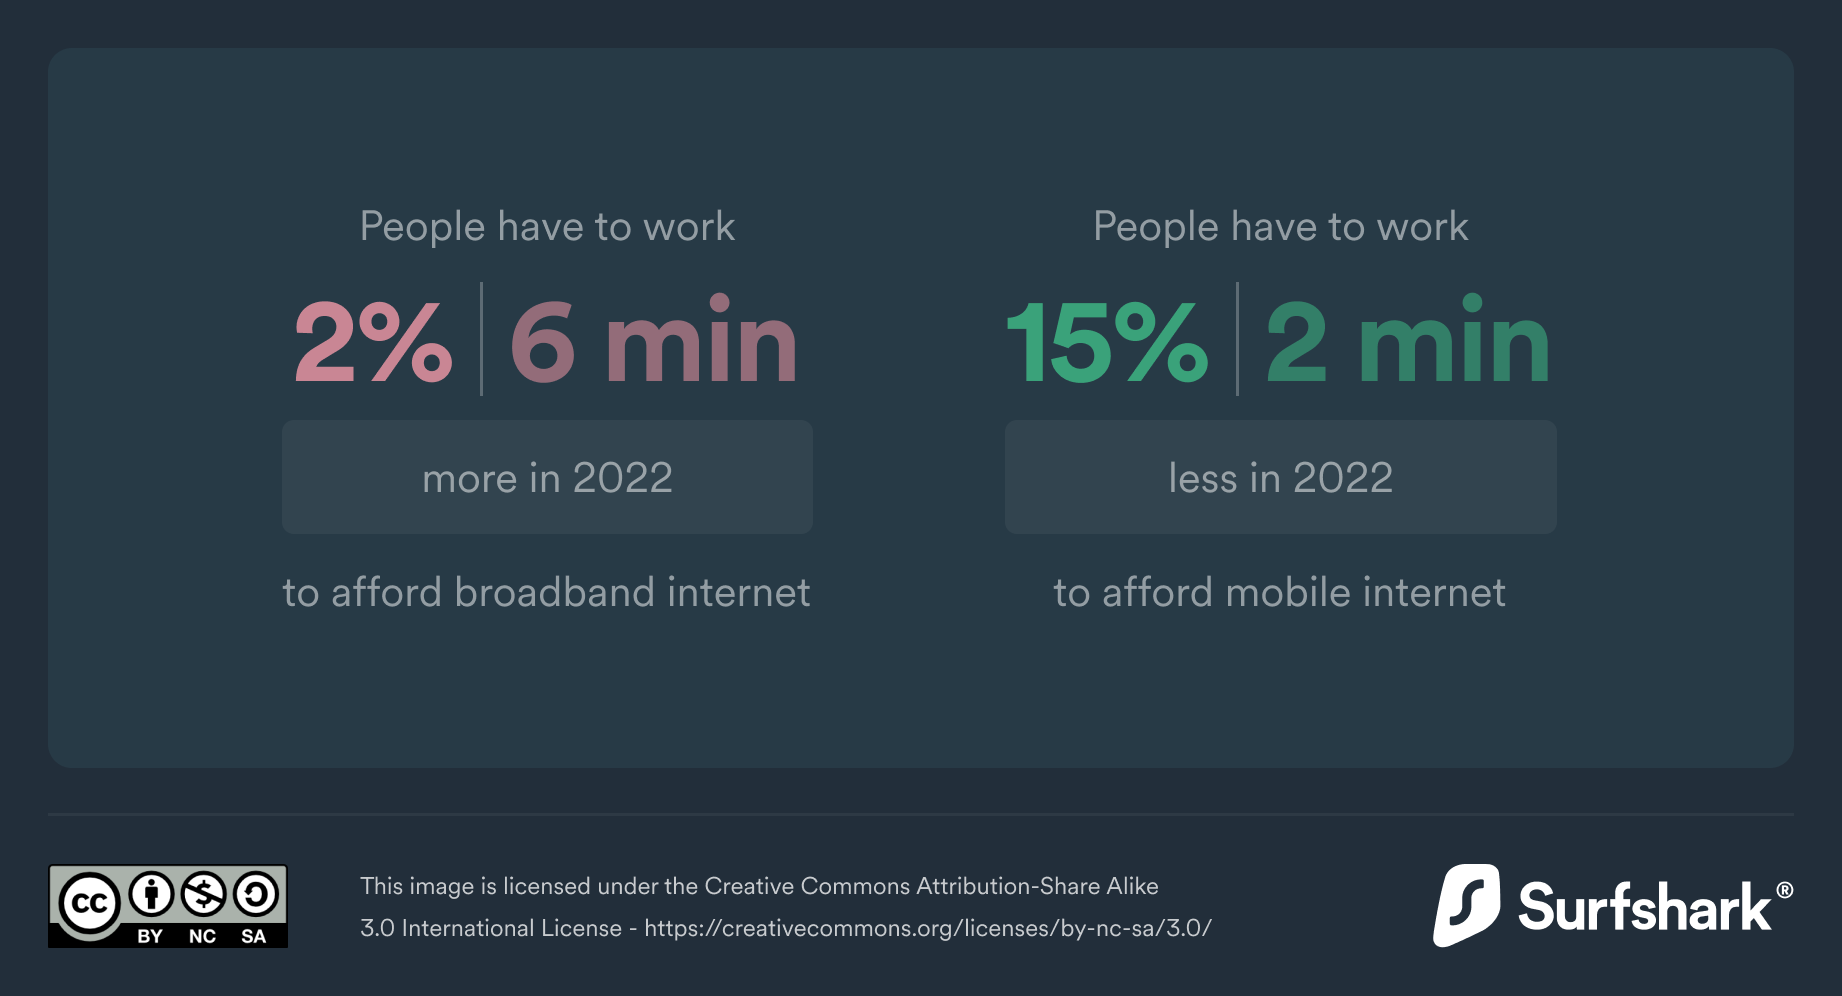
Globally the internet is less affordable.
Comparing countries included in last year's index, people have to work slightly more (6 min) to afford fixed broadband internet in 2022. While mobile internet is more affordable this year, people have to work just under 2 minutes less than they did in 2021. The same trend was observed last year.
People have to work
2%
6 min
more in 2022
to afford broadband internet
People have to work
15%
2 min
less in 2022
to afford mobile internet
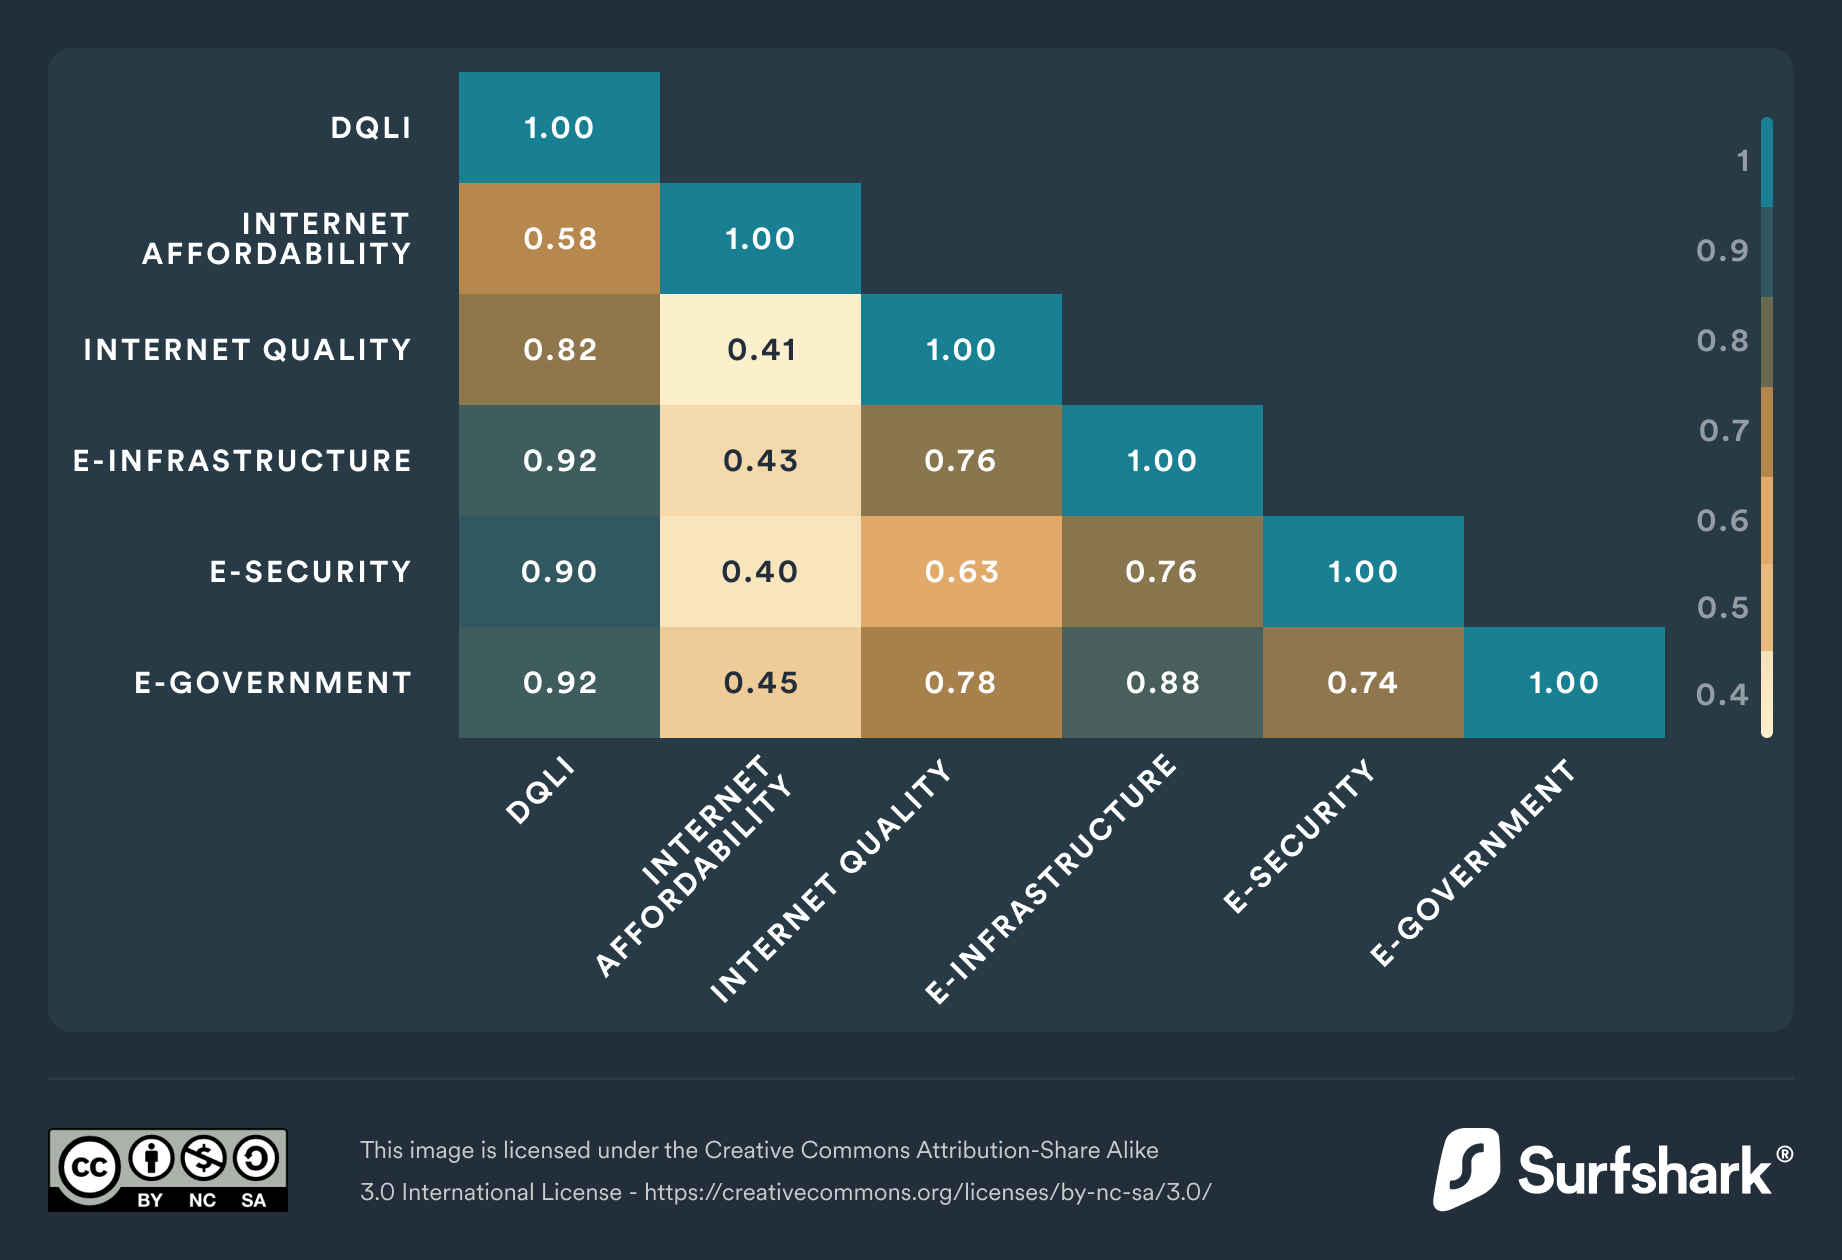
Investing into electronic infrastructure (0.92 correlation) and electronic government (0.92 correlation) has contributed to people’s digital wellbeing the most.
In contrast, internet affordability revealed itself as the least important factor in the entire DQL (0.58 correlation).

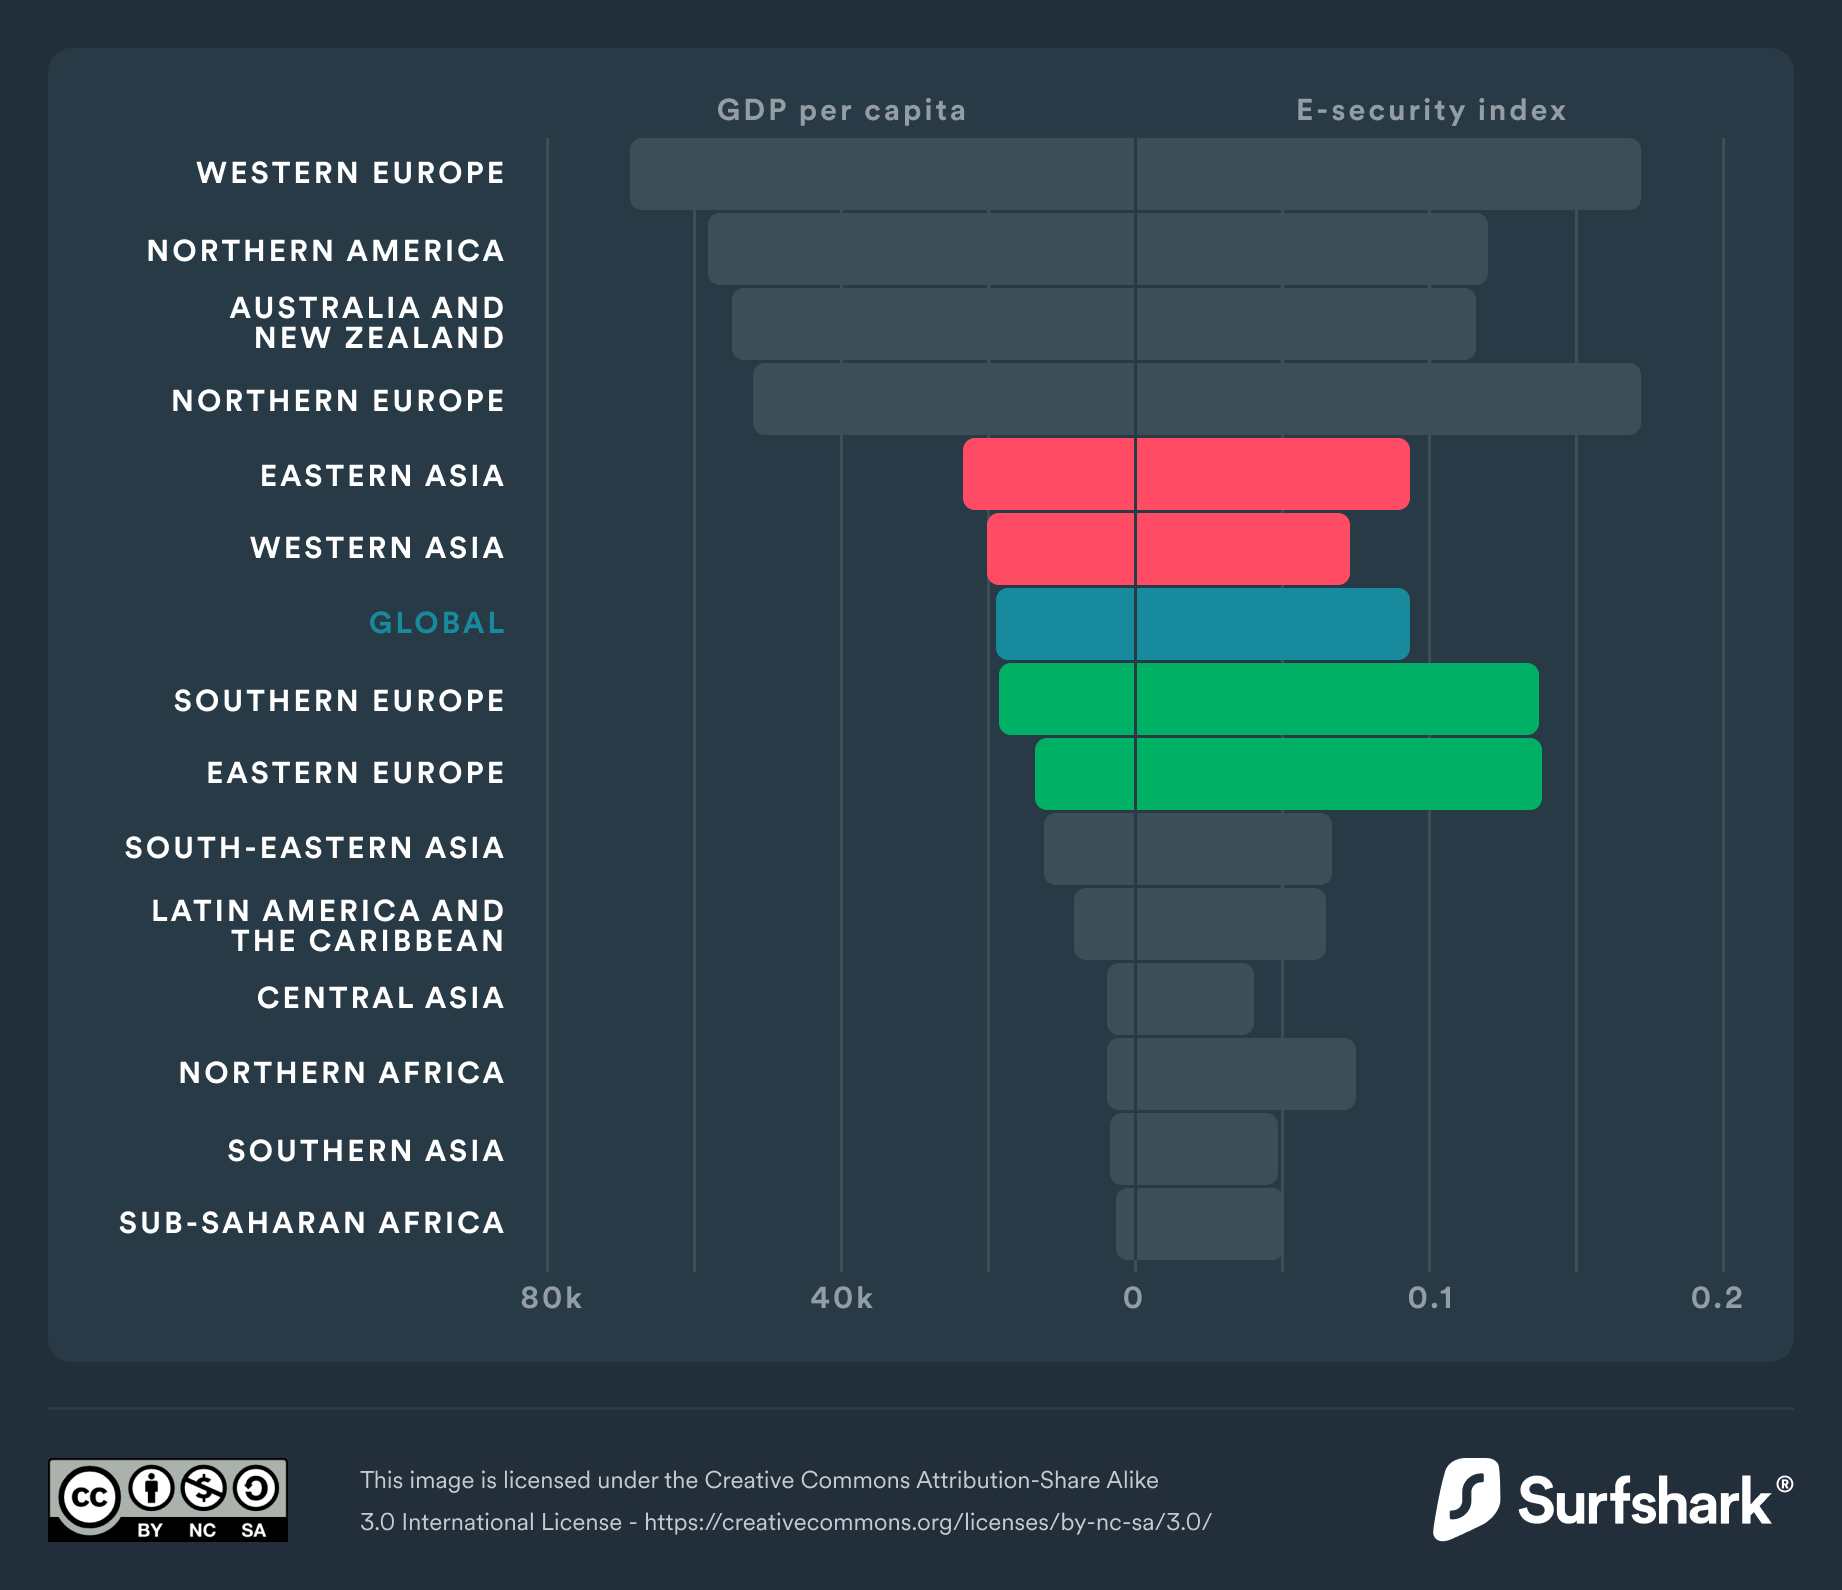
Money doesn’t always buy digital happiness:
- GDP per capita doesn’t necessarily determine a country’s e-infrastructure quality.

- GDP per capita isn’t the core driving factor for e-security.
- Internet usage drives e-government’s development more than GDP per capita.
- *GDP per capita measures the monetary value of final goods and services produced in a country per person in a given year and is used to indicate wealth and prosperity.
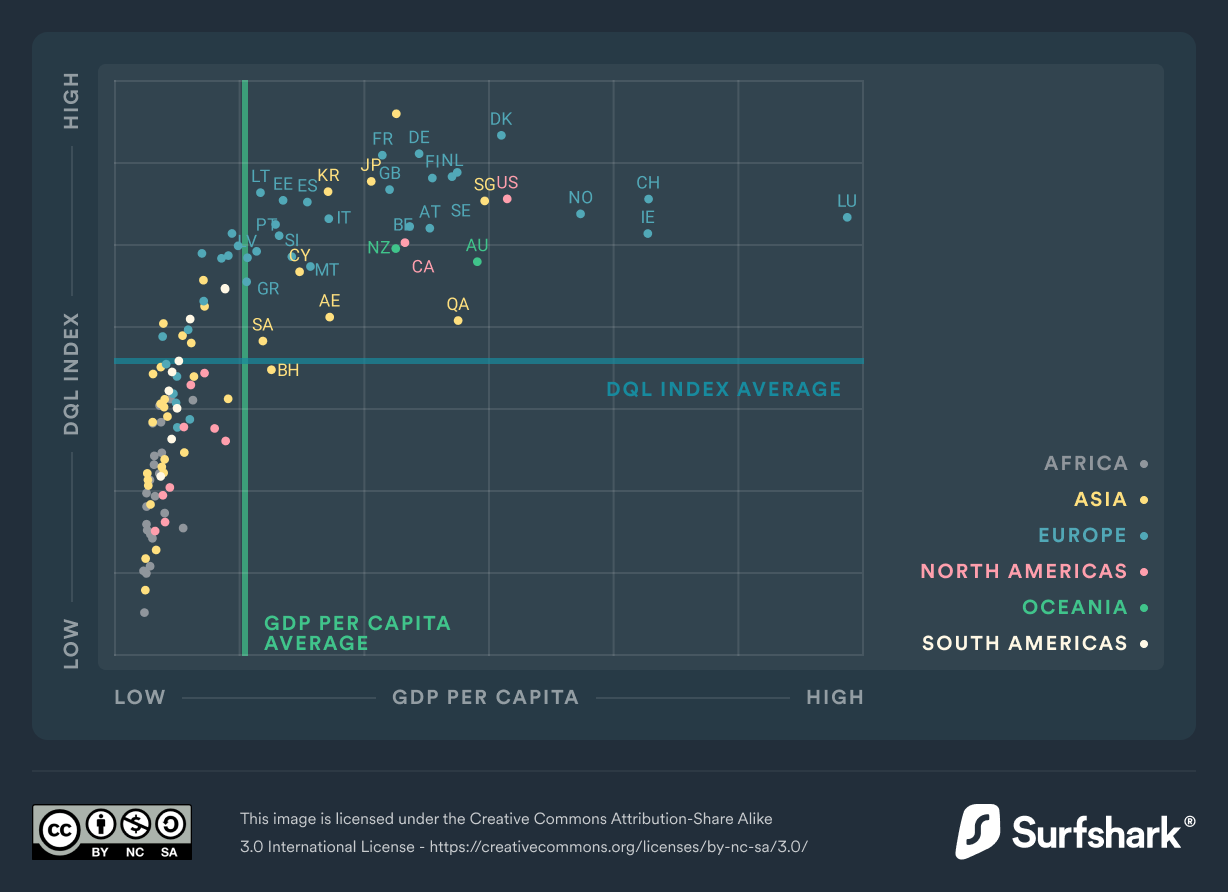
Although GDP per capita has a strong correlation with the DQL, there are countries that have better digital quality of life with lower GDP per capita than expected.
Out of 117 countries, 17 exceeded the expected digital quality of life by providing higher levels of e-security and e-infrastructure, and e-government. They include Ukraine, Armenia, Brazil, Thailand, Serbia, Argentina, Turkey, Bulgaria, Malaysia, Russia, China, Romania, Chile, Uruguay, Croatia, Poland, and Hungary.
All three of these pillars have a more significant correlation with the DQL than GDP per capita. This proves the potential to level up the global digital wellbeing with lower resources and more focused strategic planning.

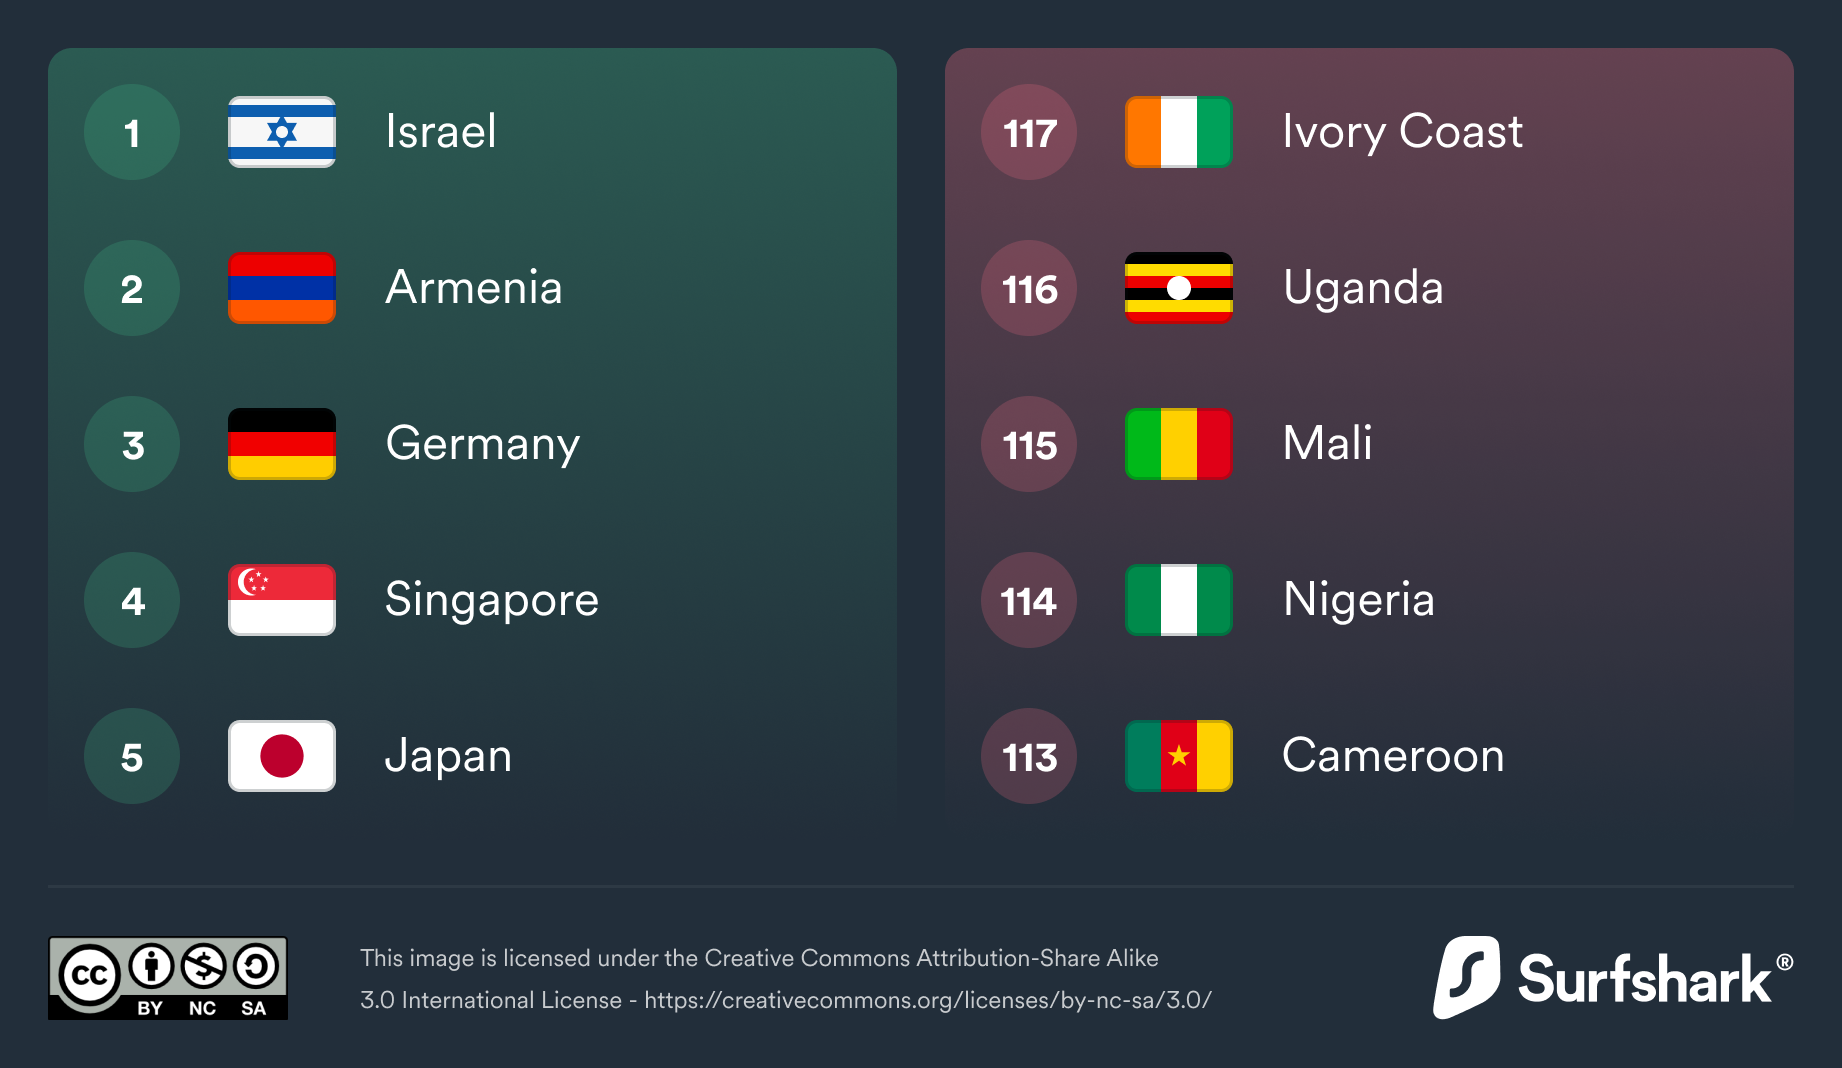
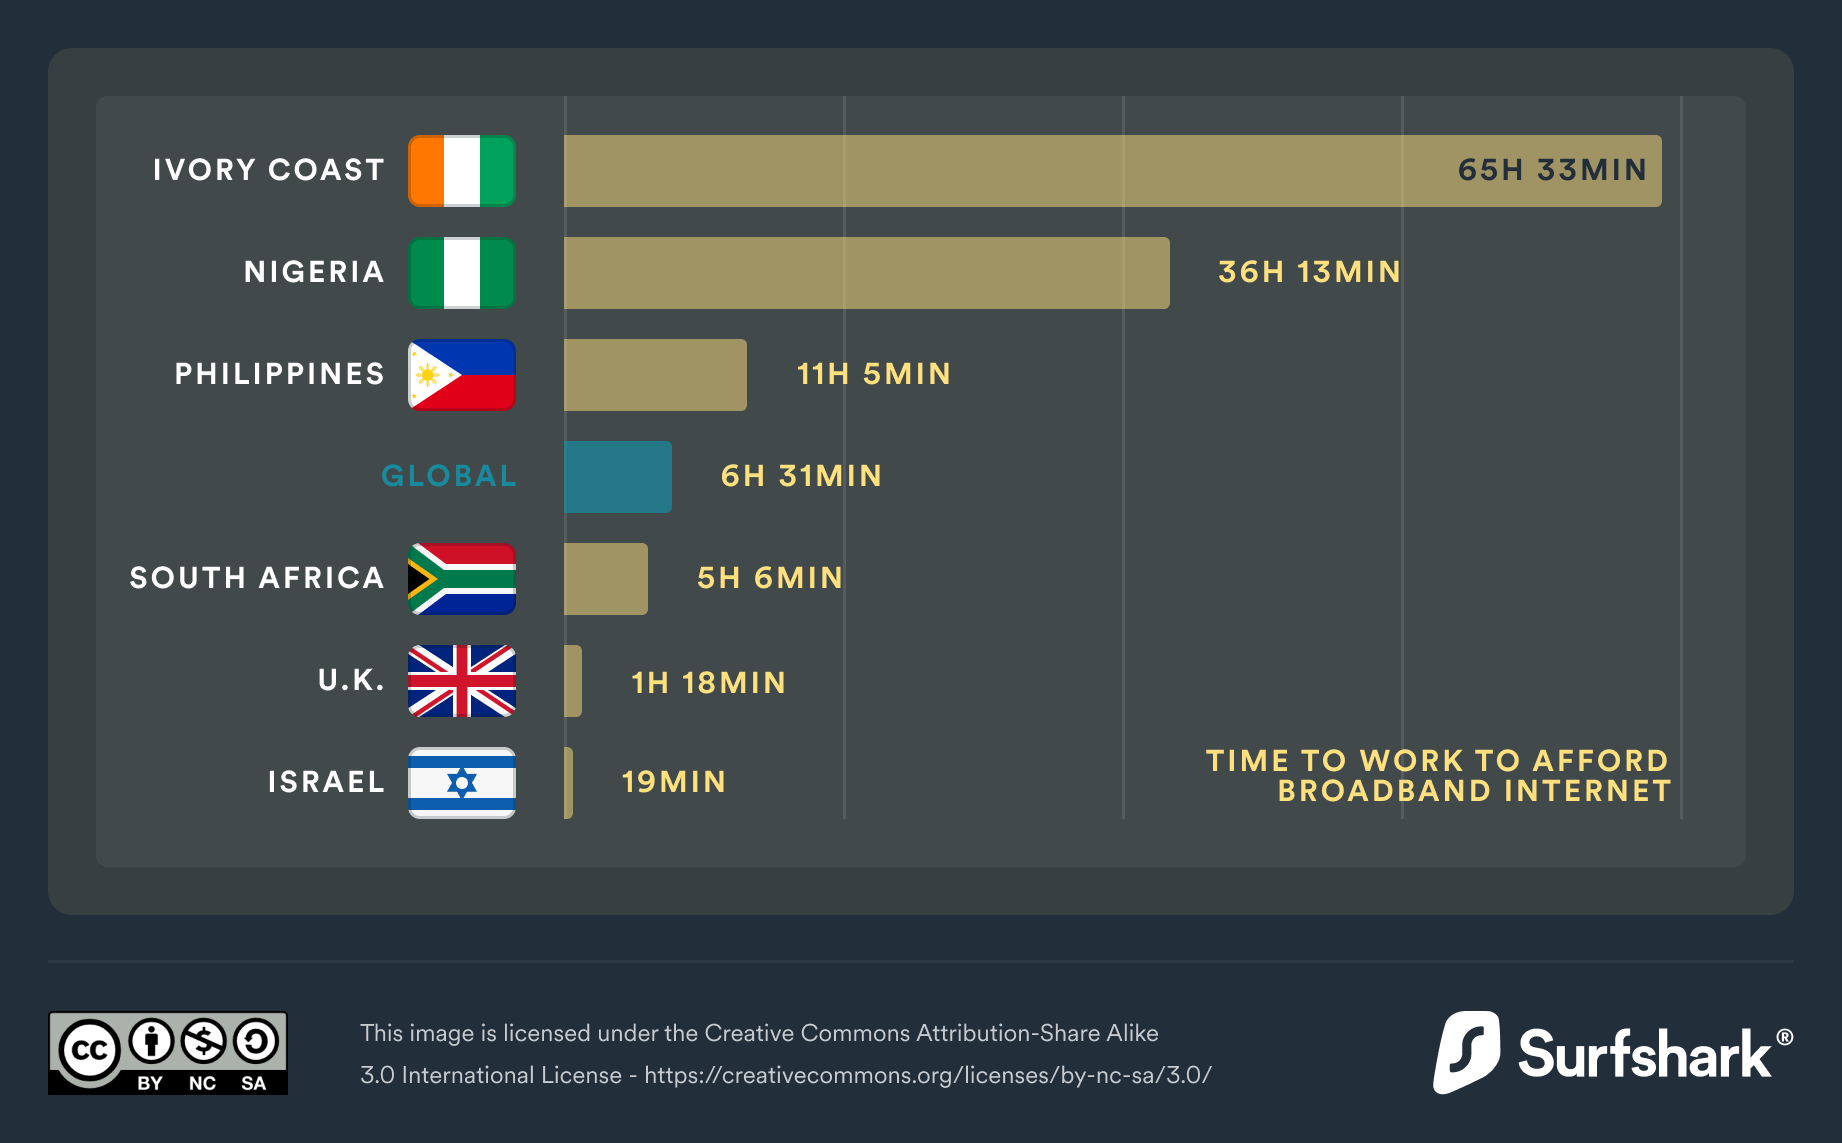
Internet affordability key insights
Time of work required to afford the cheapest mobile internet + Time of work required to afford the cheapest broadband internet
Most and least affordable internet
- Israel
- Armenia
- Germany
- Singapore
- Japan
- Ivory Coast
- Uganda
- Mali
- Nigeria
- Cameroon
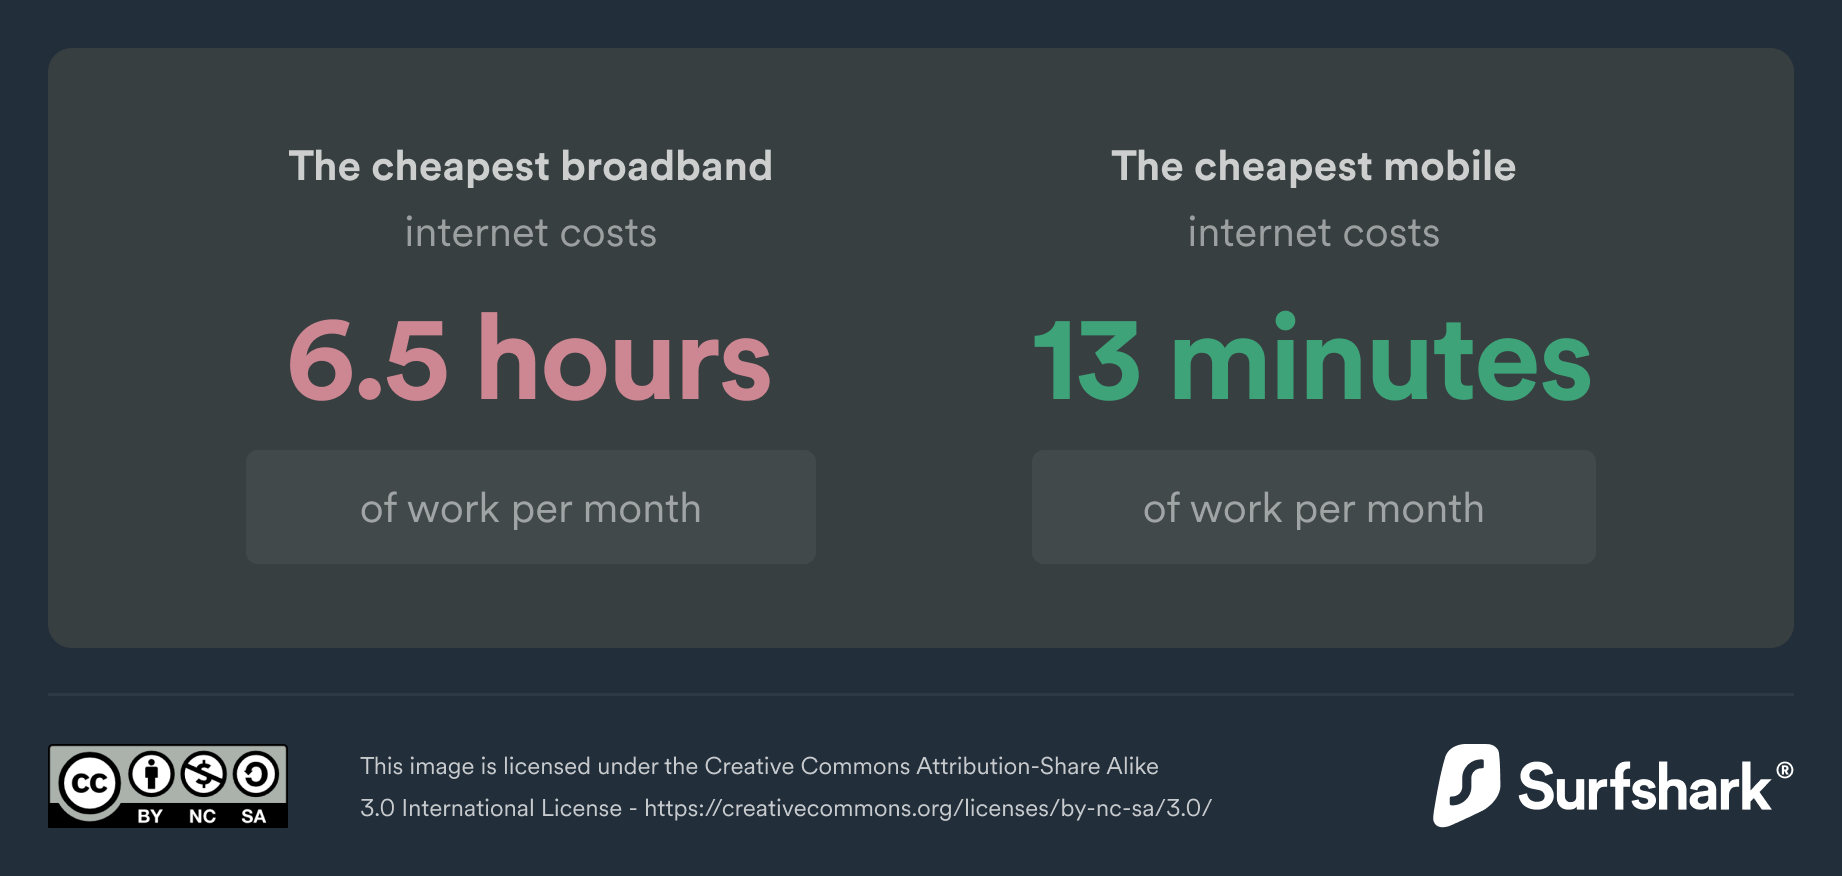
On average, fixed broadband is significantly less affordable than mobile internet
- The cheapest fixed broadband internet costs around 6.5 hours of work per month.
- The cheapest mobile internet costs around 13 minutes of work per month.
The cheapest broadband
internet costs
internet costs
6.5 hours
of work per month
The cheapest mobile
internet costs
internet costs
13 minutes
of work per month
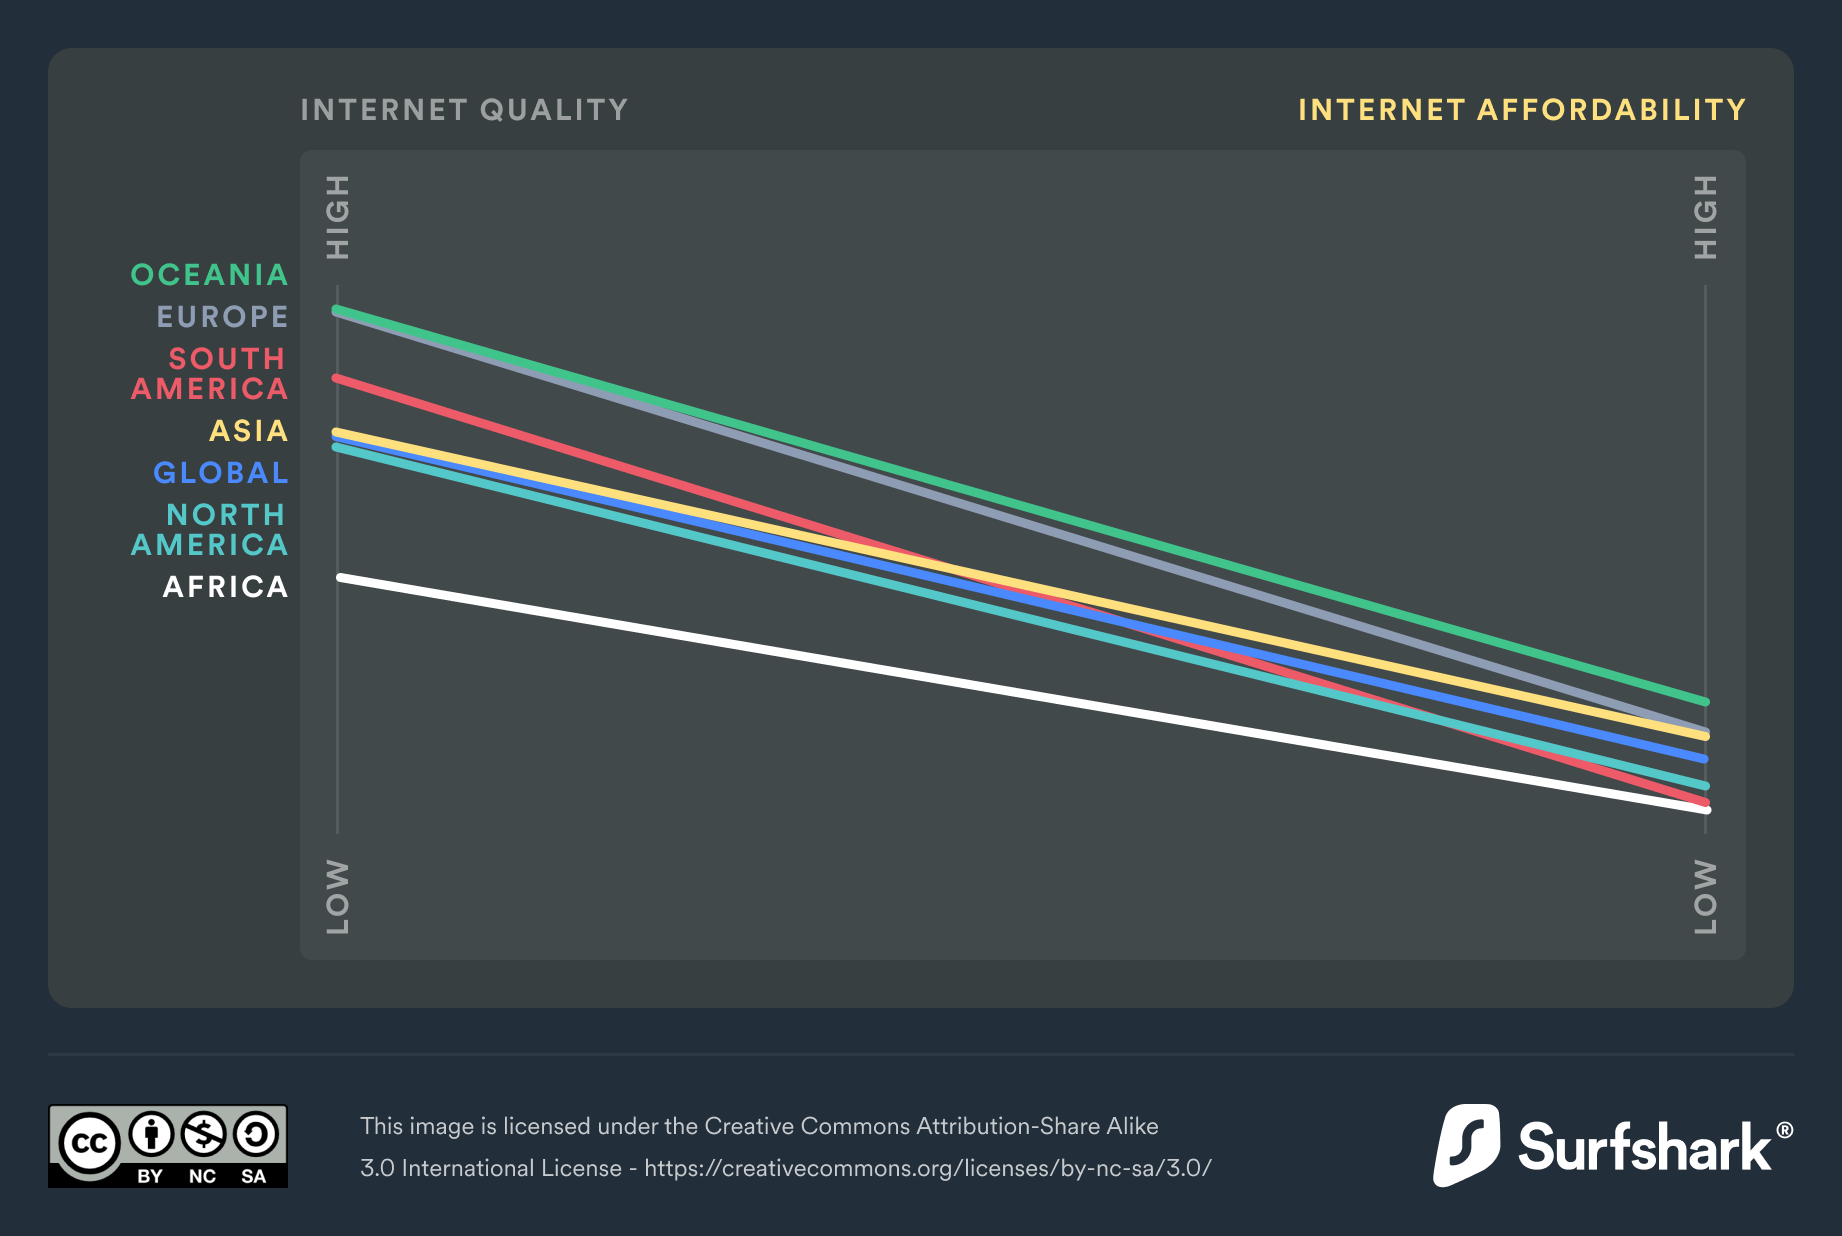
The world’s poorest countries pay the most for bad quality internet
Nearly half of the countries examined in the DQL have lower than global average internet affordability and internet quality. The average GDP per capita in these countries is only about a third of the global GDP average (19,175 USD).

Some people have to work flat out for two weeks just to afford the internet
The Ivory Coast has the least affordable fixed internet of any country in the world. Here citizens have to work 10 times more (65h 33min) than the global average (6h 31min) to afford a monthly subscription. In Botswana, the country with the least affordable mobile internet, one has to work 12 times longer (2h 43min) than the global average (13min) to afford 1GB of data.

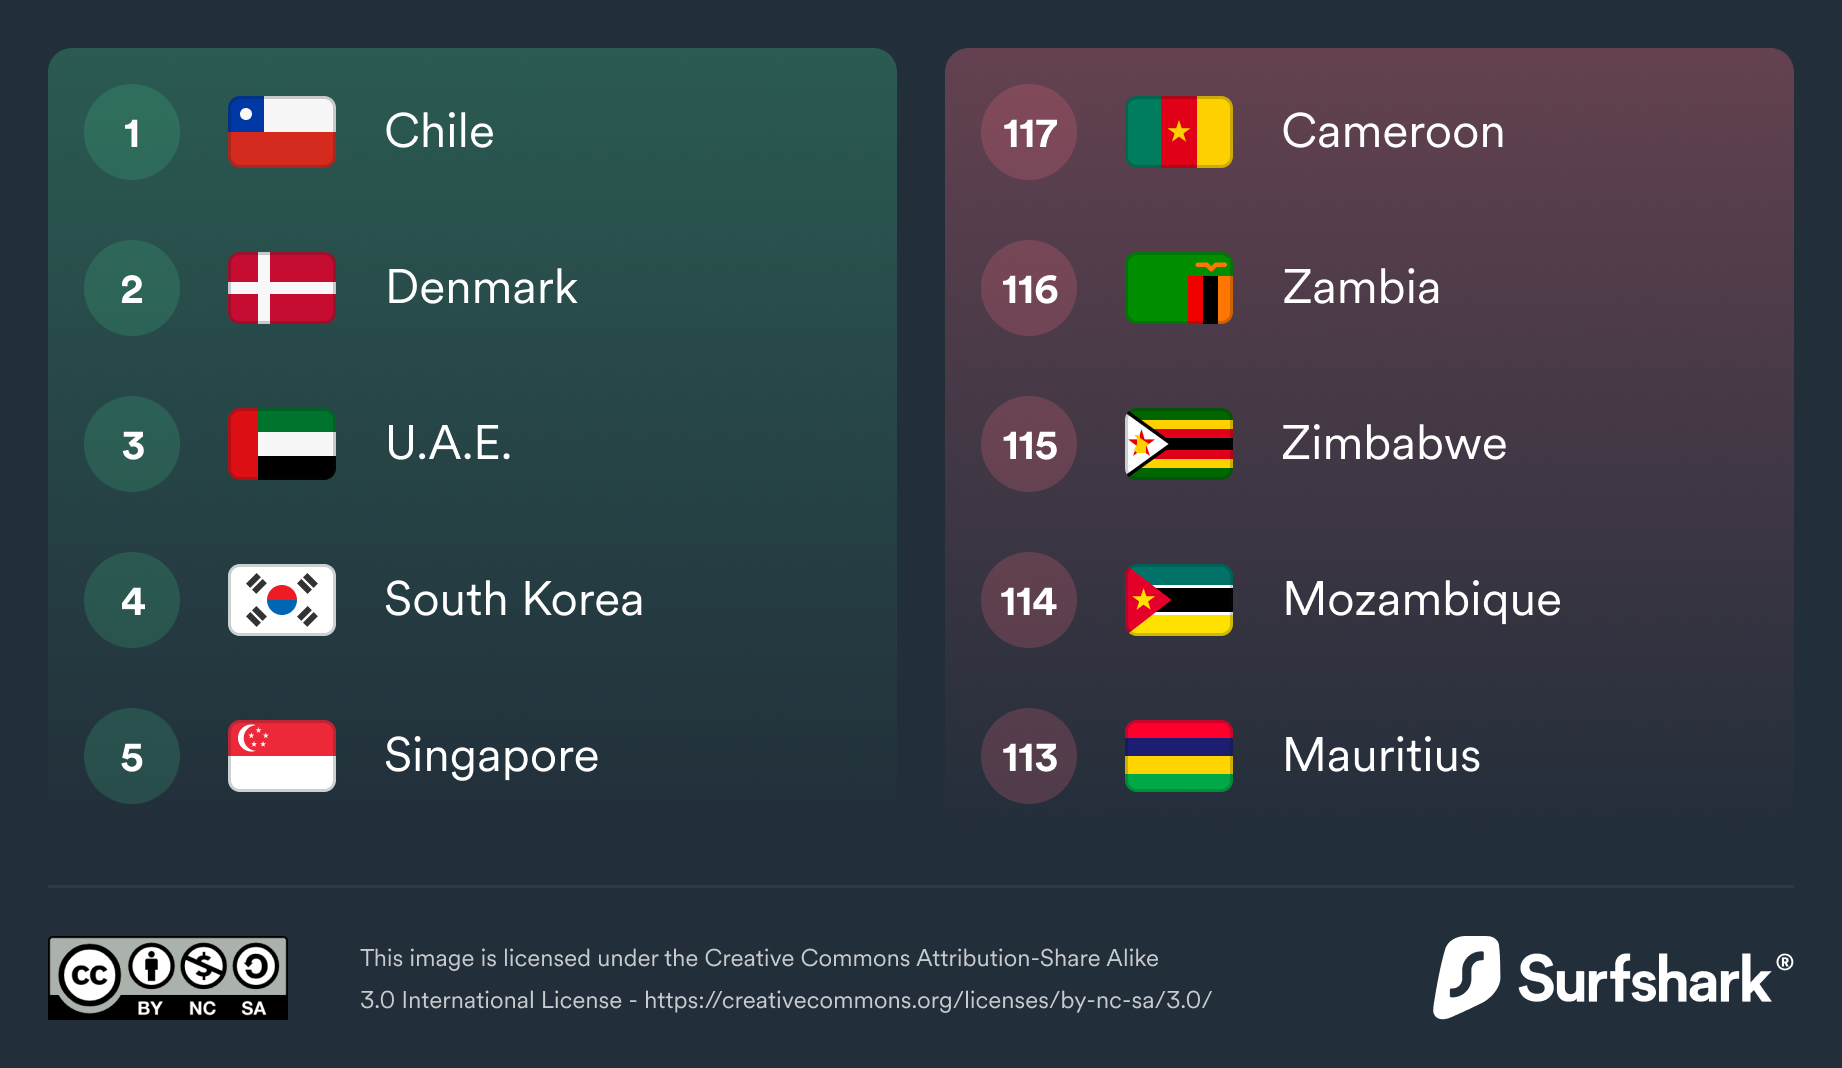
Internet quality key insights
Sum of mobile and broadband speeds, their stability, and growth indices.
Best and worst quality internet
- Chile
- Denmark
- U.A.E.
- South Korea
- Singapore
- Cameroon
- Zambia
- Zimbabwe
- Mozambique
- Mauritius
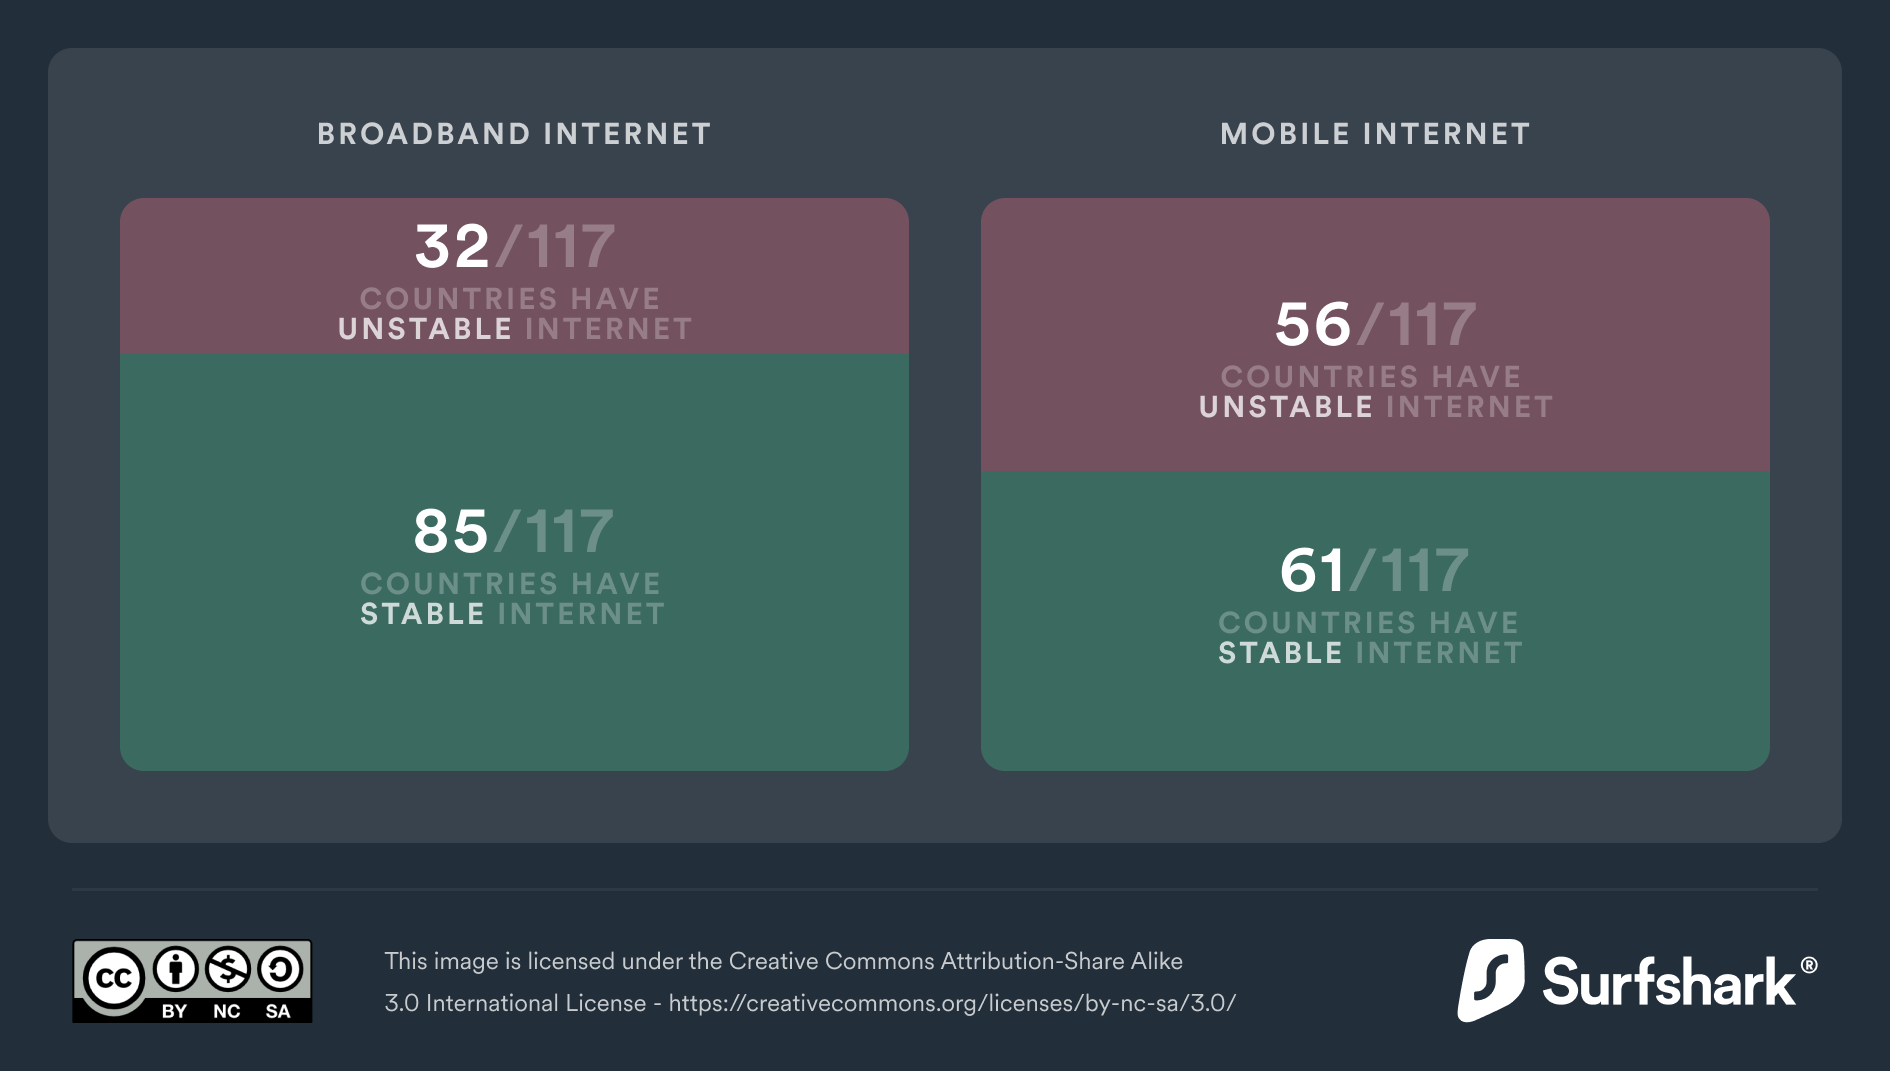
Mobile internet is generally less stable than fixed internet.
- 7 out of 10 countries enjoy stable fixed internet. However, only 5 out of 10 countries can say the same for mobile data.
- Between February and March, Ukraine saw a 28% drop in mobile internet speed and a 19% drop in fixed internet speed due to the Russian invasion. Even though the country managed to partially recover its internet speeds (by more than 10%), the internet is still slower (10-17%) than it was before the war.

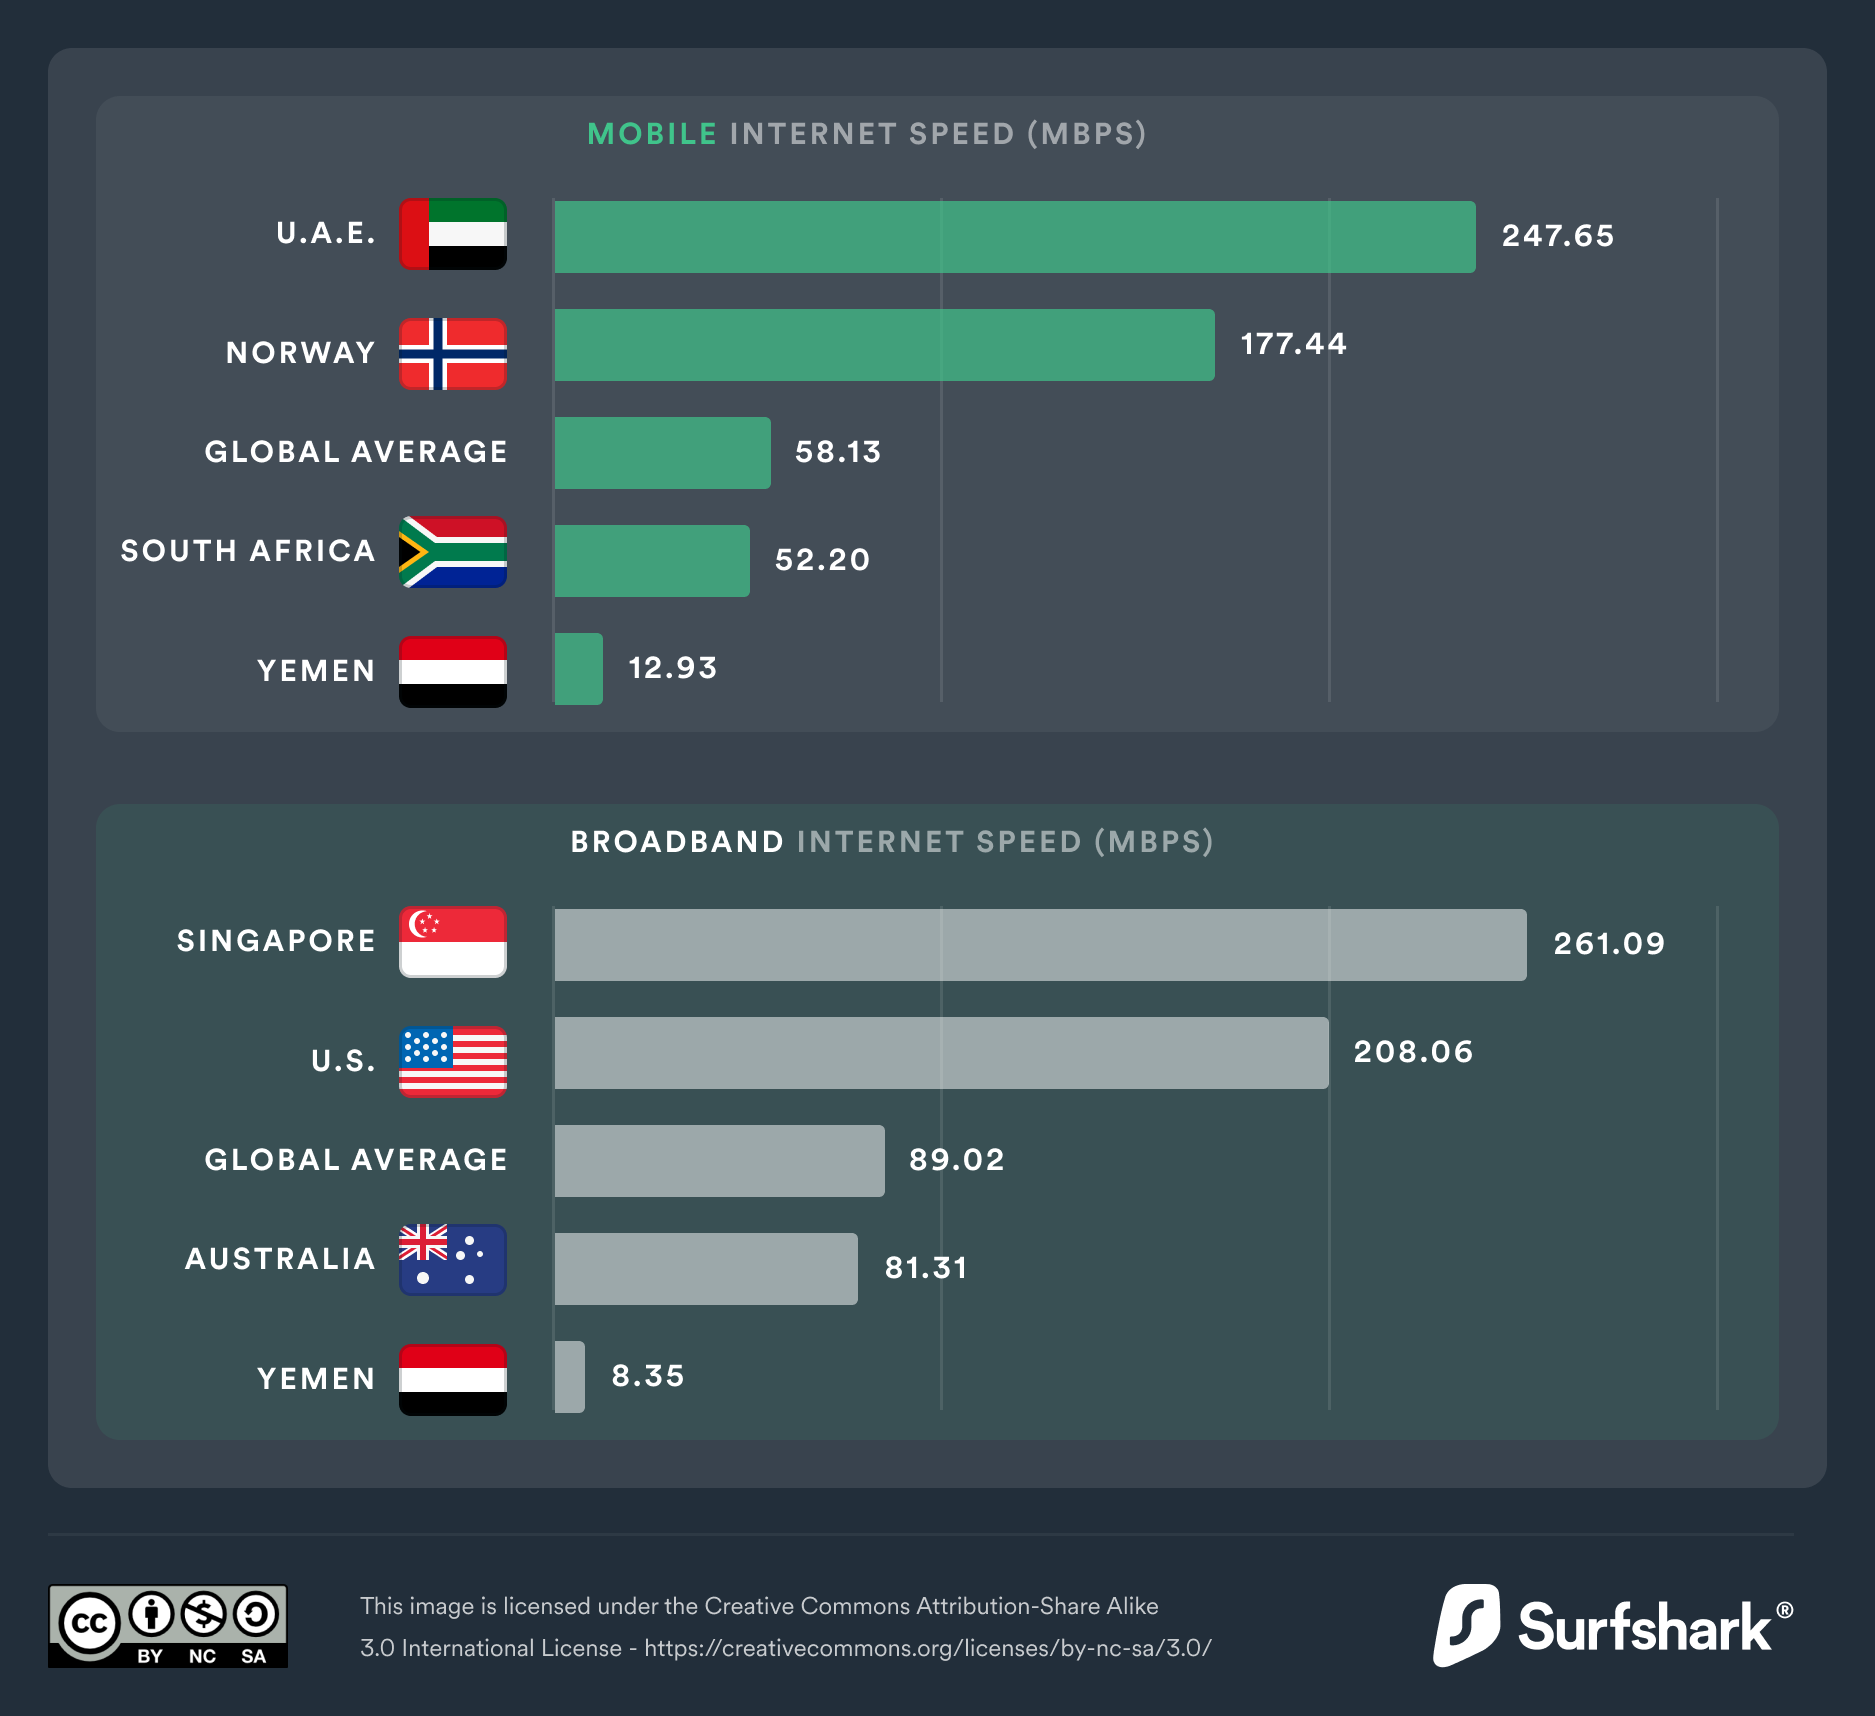
There is a major divide between countries at the top and the bottom in terms of internet quality.
For instance, Yemen's mobile internet speed (13Mbps) is only 5% of the United Arab Emirates (248Mbps). There is an even larger inequality in fixed internet speeds with Yemen’s 8Mbps performing at only 3% compared to Singapore’s 261Mbps.

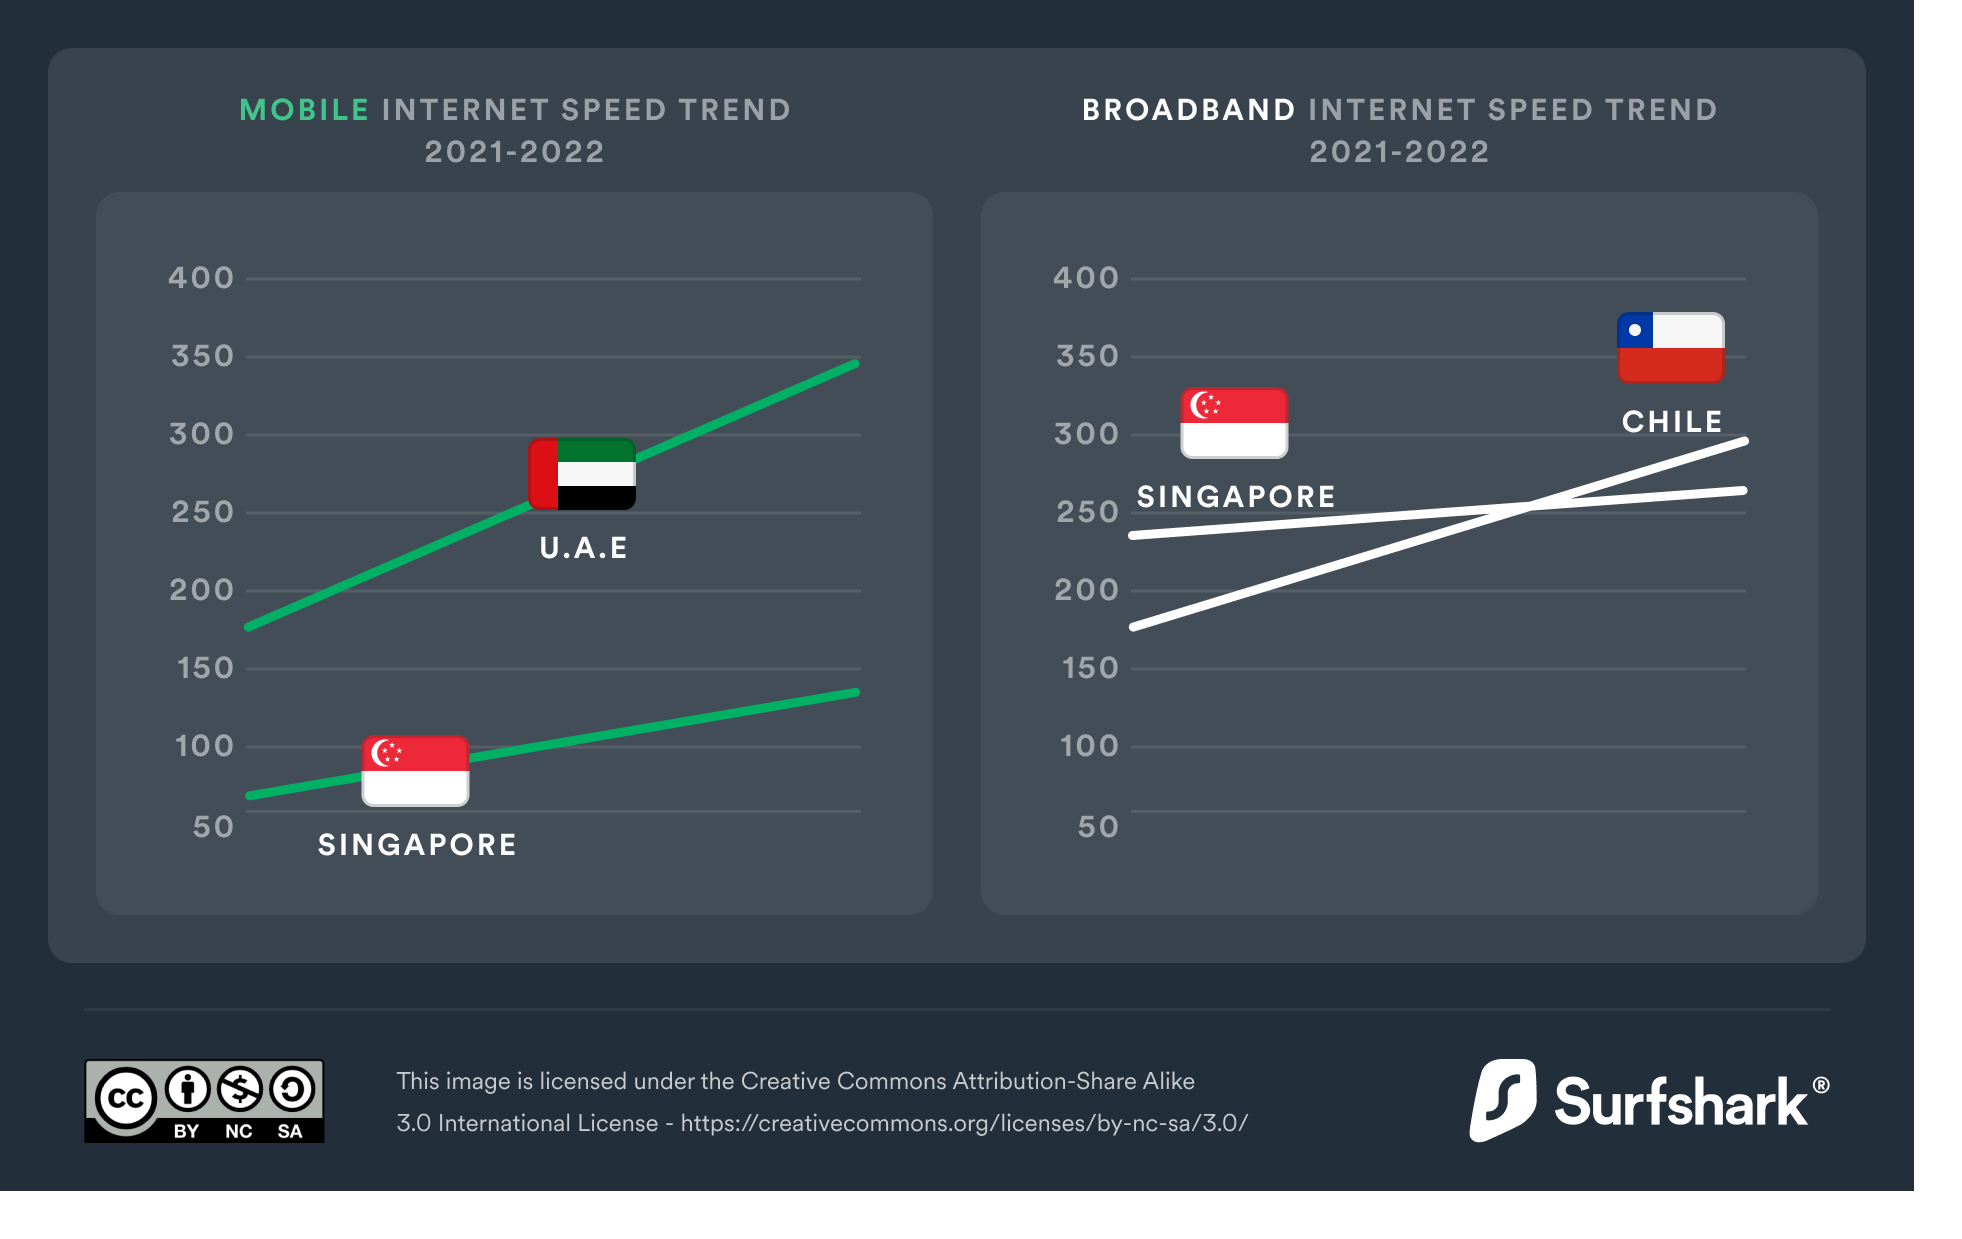
Singapore and the UAE have the fastest internet for the second year running.
The UAE has exceptionally fast mobile internet that almost doubled in speed compared to last year. Its yearly average speed (248Mbps) is only 5% slower than that of Singapore's fixed broadband internet speed. Singapore still has the fastest fixed broadband internet and steady growth, but in a few months’ time, Chile might surpass them and reach 300Mbp.

Electronic infrastructure key insights
Active internet users (per 100 inhabitants) + Network Readiness Index
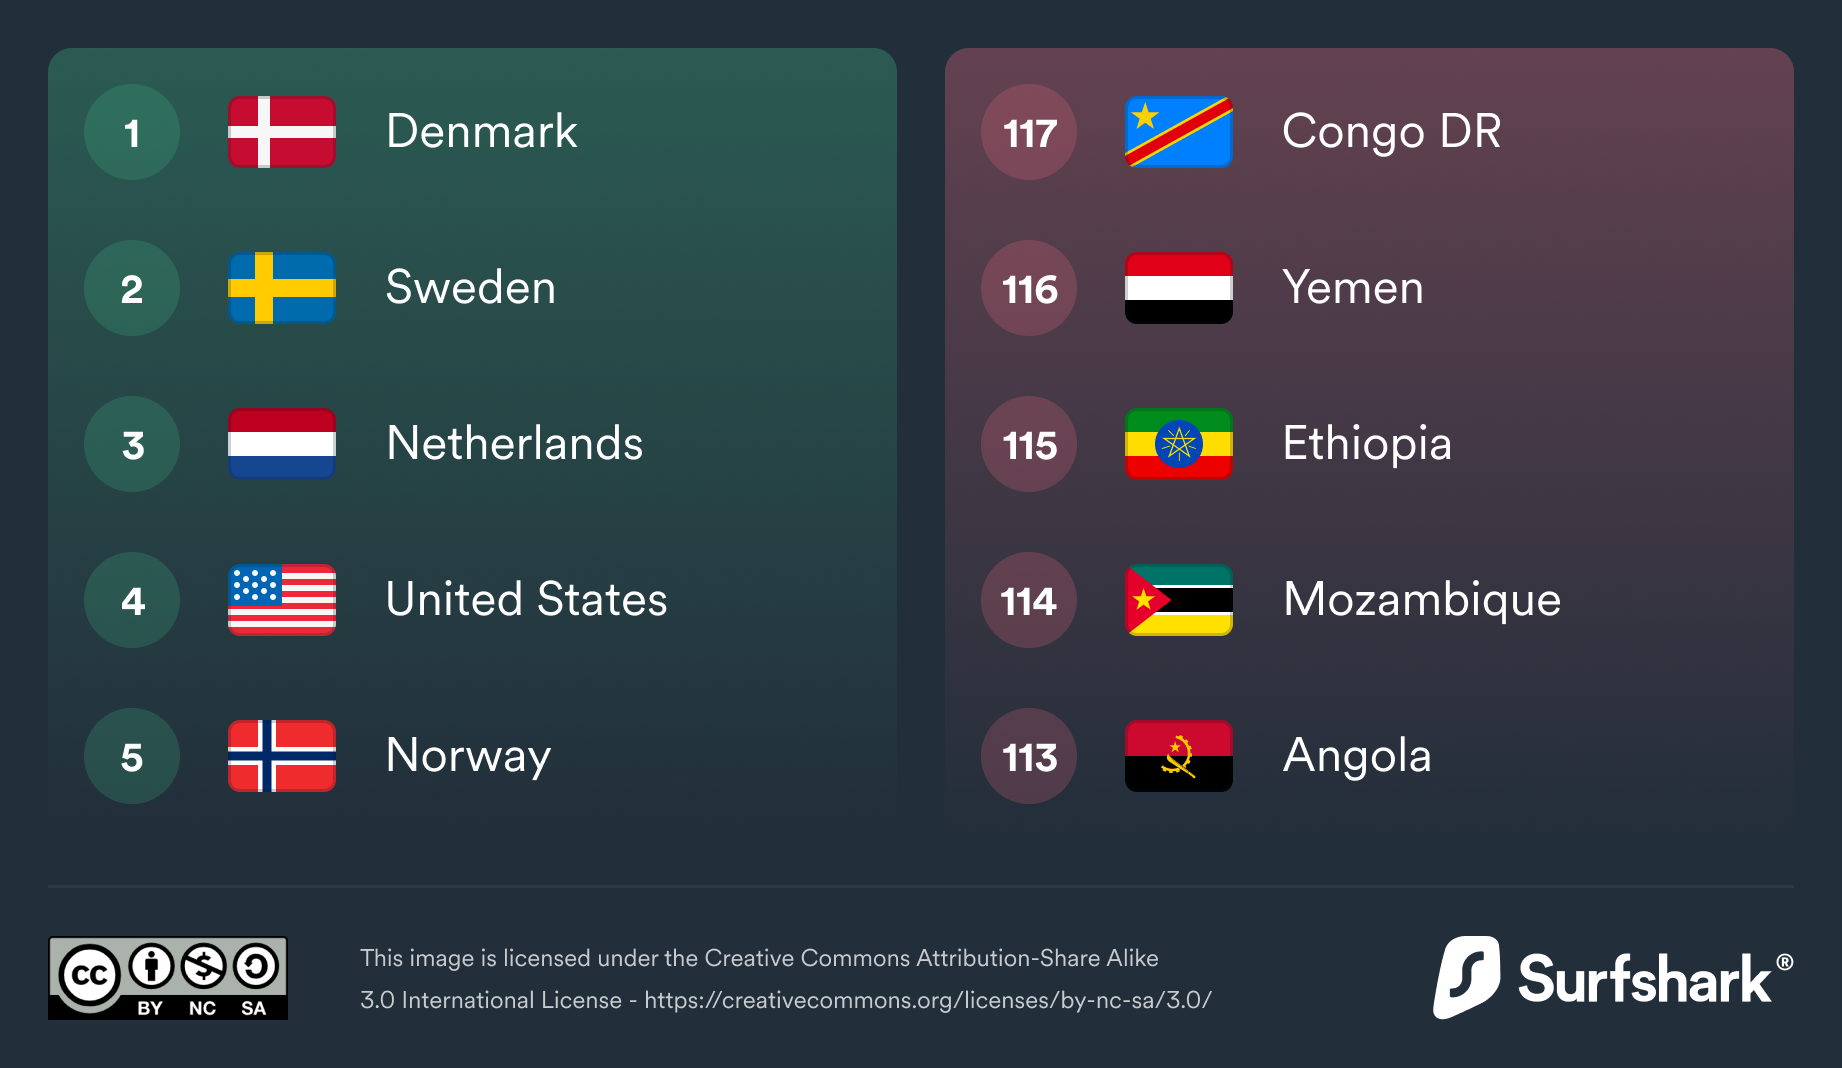
Most and least developed e-infrastructure
- Denmark
- Sweden
- Netherlands
- United States
- Norway
- Congo DR
- Yemen
- Ethiopia
- Mozambique
- Angola
GDP is less important for the development of e-infrastructure
26 countries (22.2% of the sample) examined in the DQL index have a lower than average GDP but higher than average e-infrastructure.
- 10 countries are from Asia (29% of all analyzed Asian countries)
- 9 are from Europe (24%)
- 5 are from South America (56%)
- 1 is from North America (9%) and 1 is from Africa (4%).
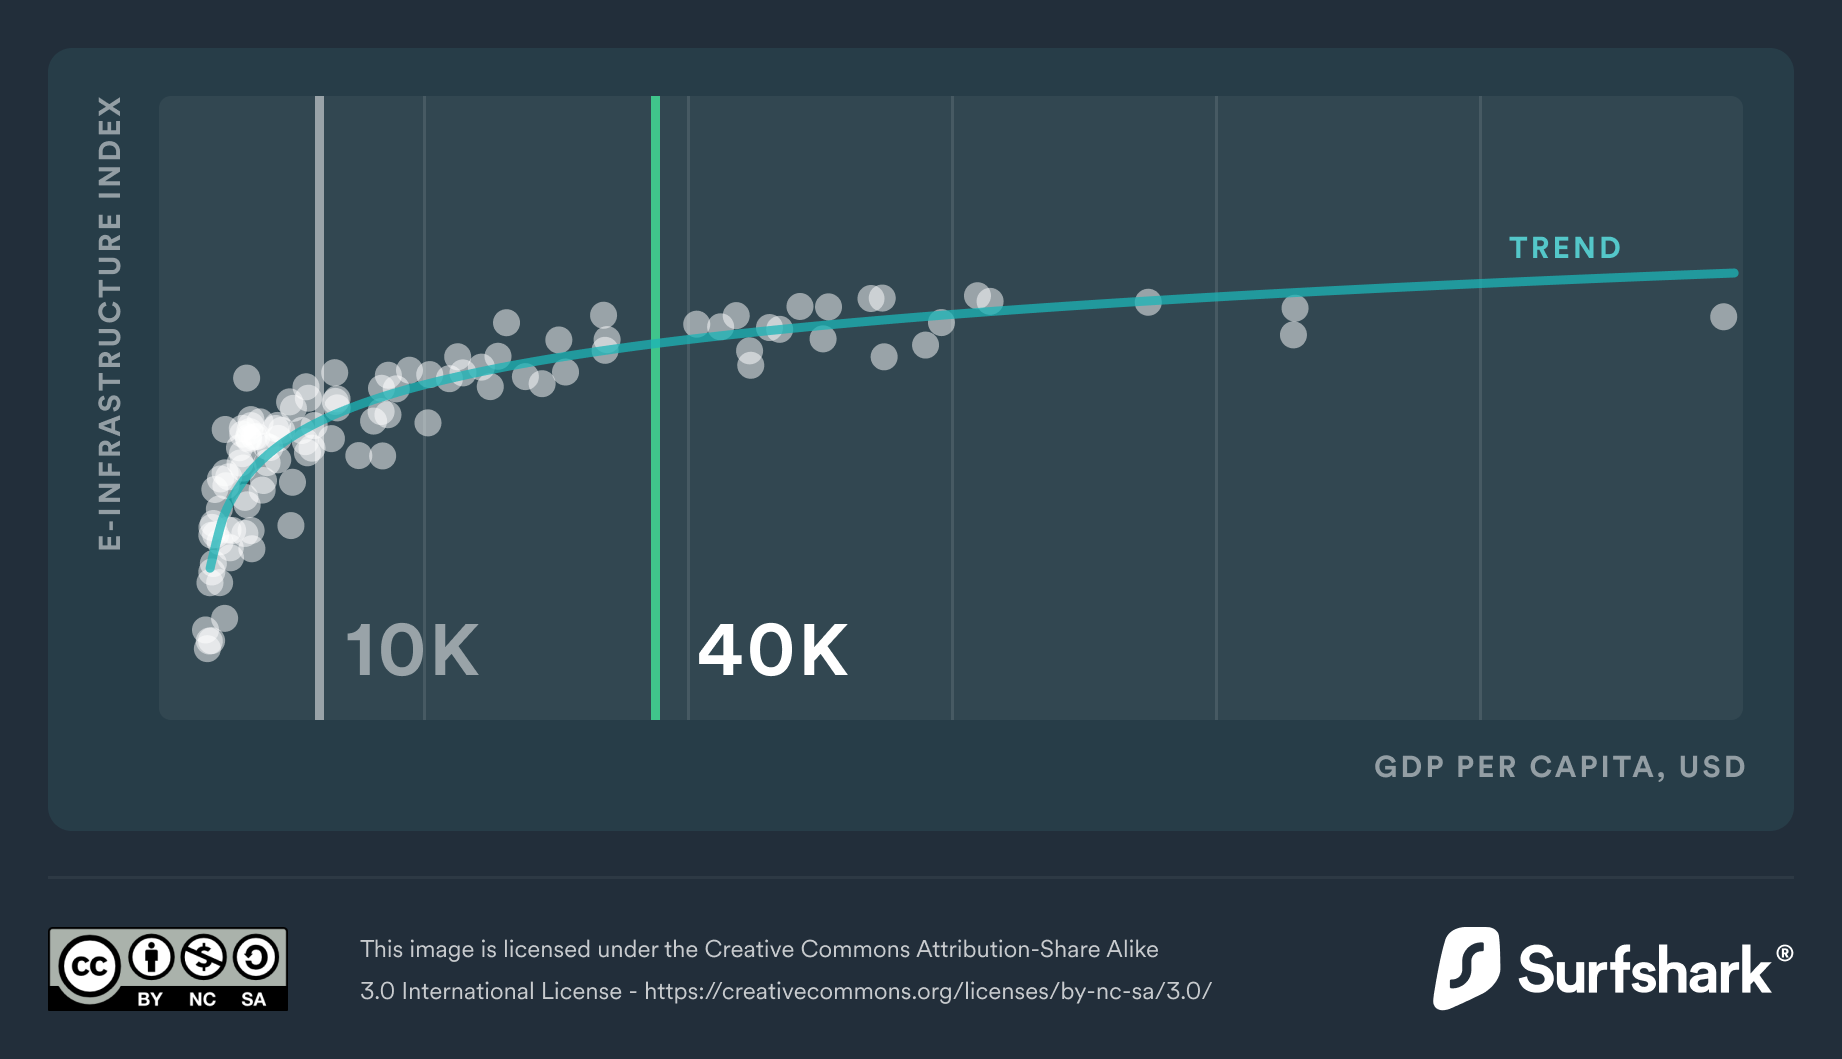
Economic wealth determines e-infrastructure growth, but only up to a point
The impact that GDP per capita has on e-infrastructure is significant when GDP per capita is up to 10k USD but slows down after that. Once GDP per capita exceeds 40k USD, e-infrastructure improvement starts to weaken. This may be due to technological limitations and/or other factors having a greater impact on e-infrastructure.

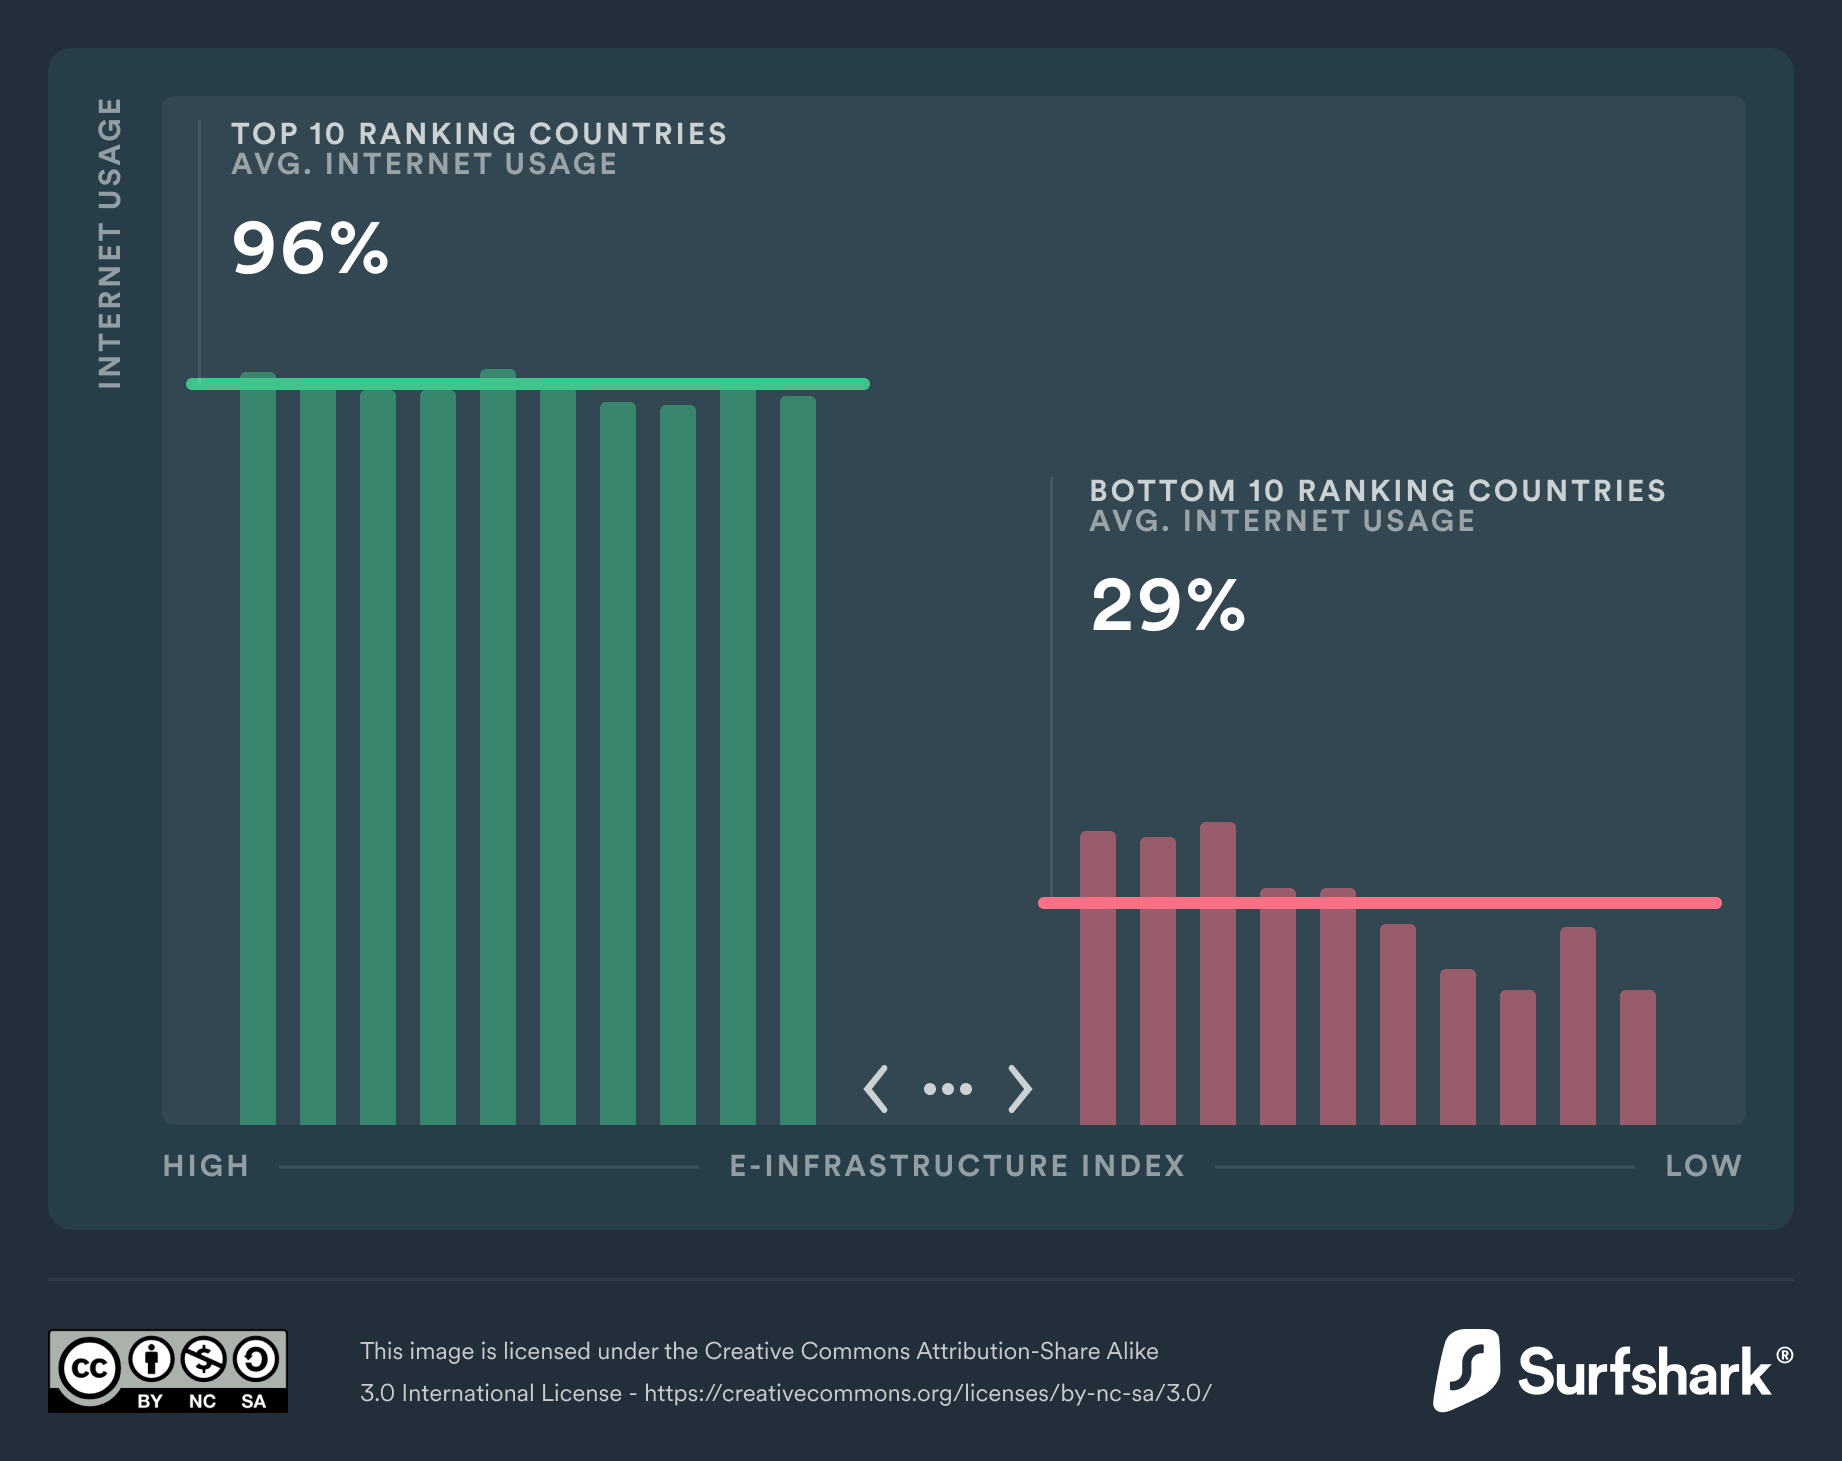
E-infrastructure is characterized by high inequality
For instance, in the 10 highest-ranking countries in e-infrastructure, 96% of the population use the internet (internet penetration). On the other hand, less than a third (29%) of people use the internet in the 10 lowest ranking countries.

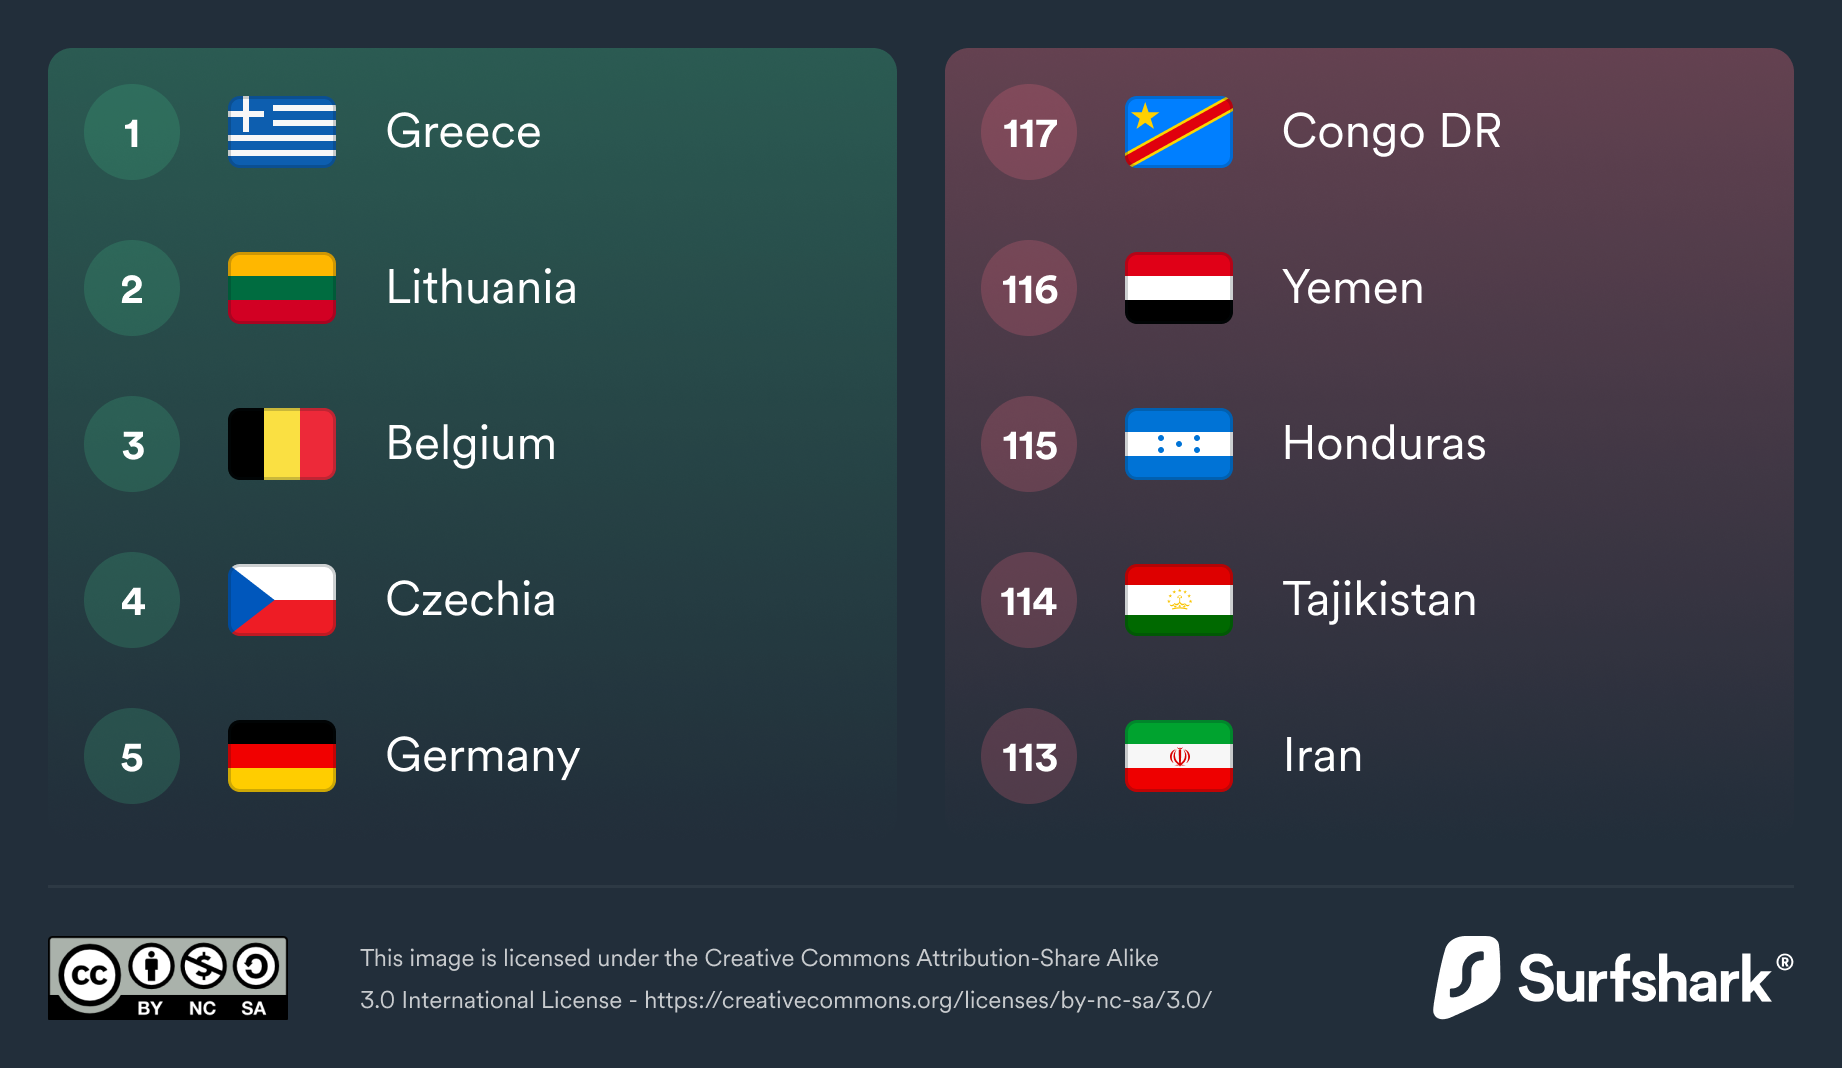
Electronic security key insights
Cybersecurity index + Status of personal data protection laws
Highest and lowest e-security
- Greece
- Lithuania
- Belgium
- Czechia
- Germany
- Congo DR
- Yemen
- Honduras
- Tajikistan
- Iran
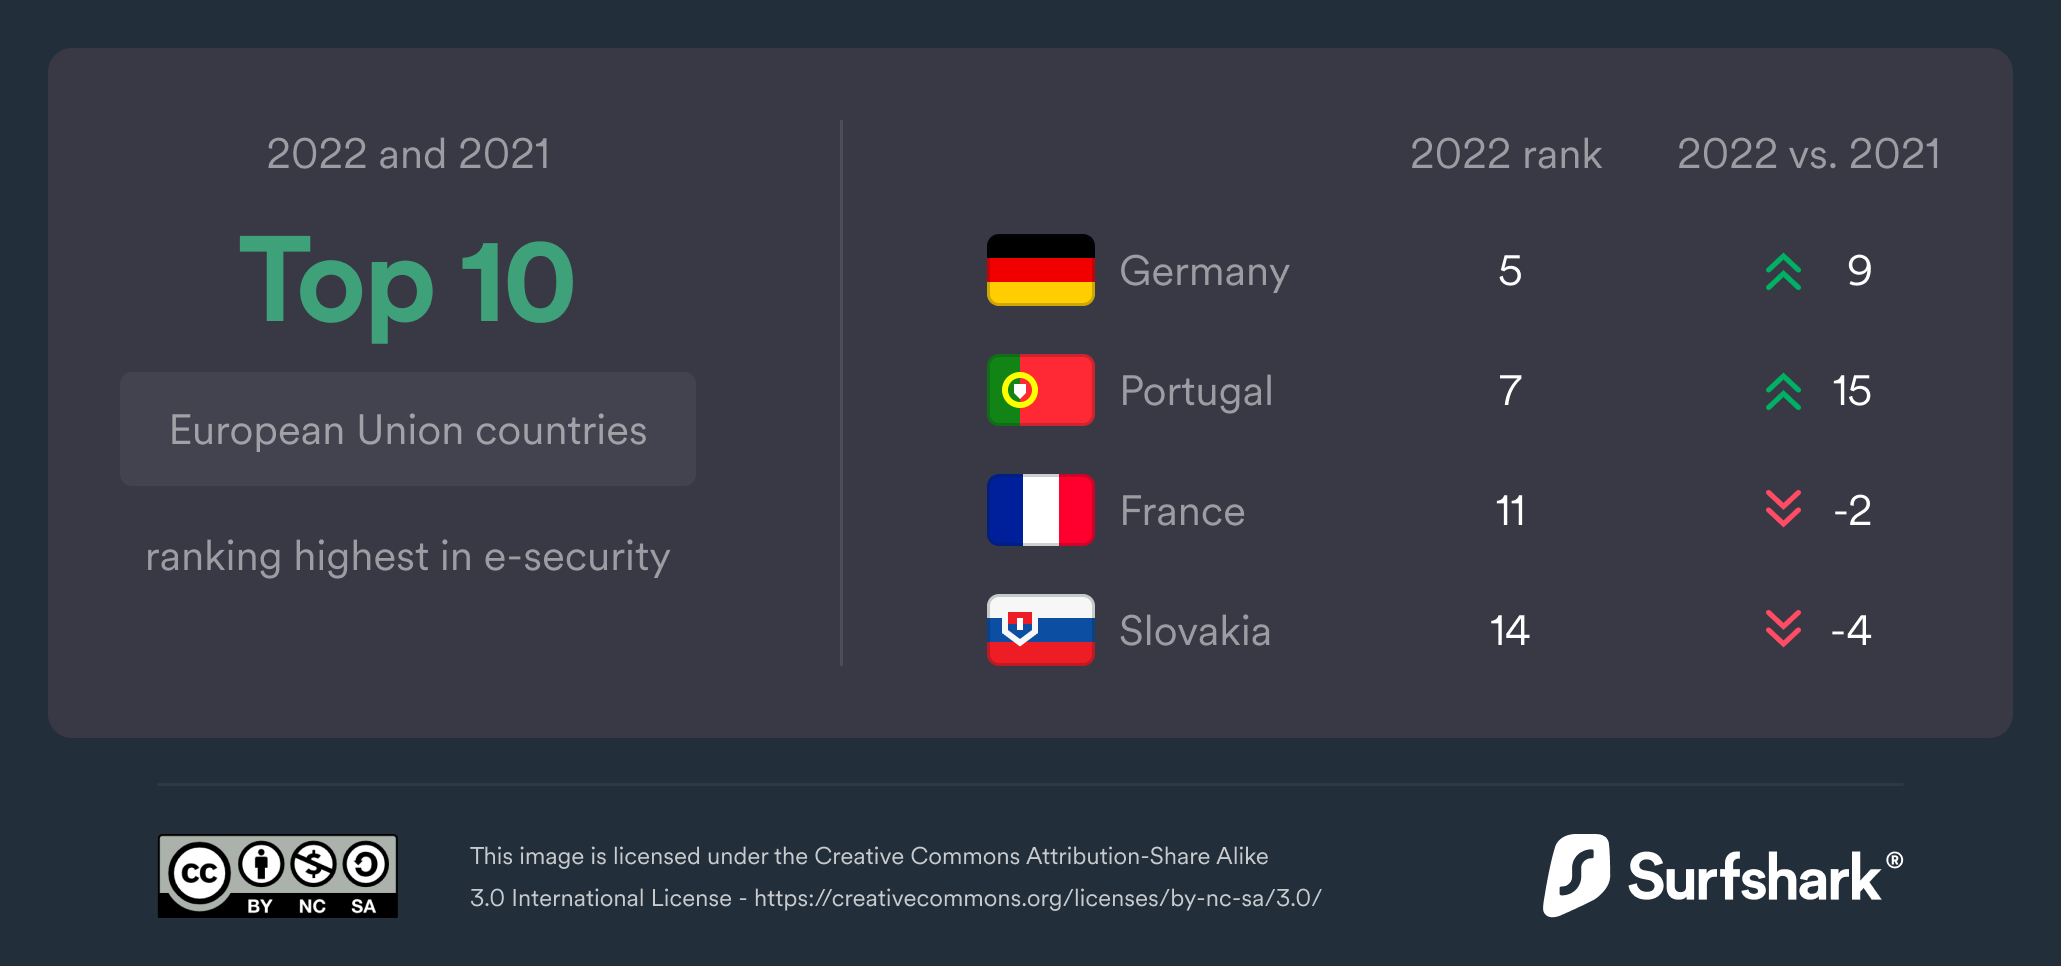
For the second year in a row, the EU ranks highest for e-security
The top 10 e-security countries are all from the European Union. Their e-security average is almost twice the size of the global average. They also lead the world in cybersecurity policy implementation to better protect the population's personal data.

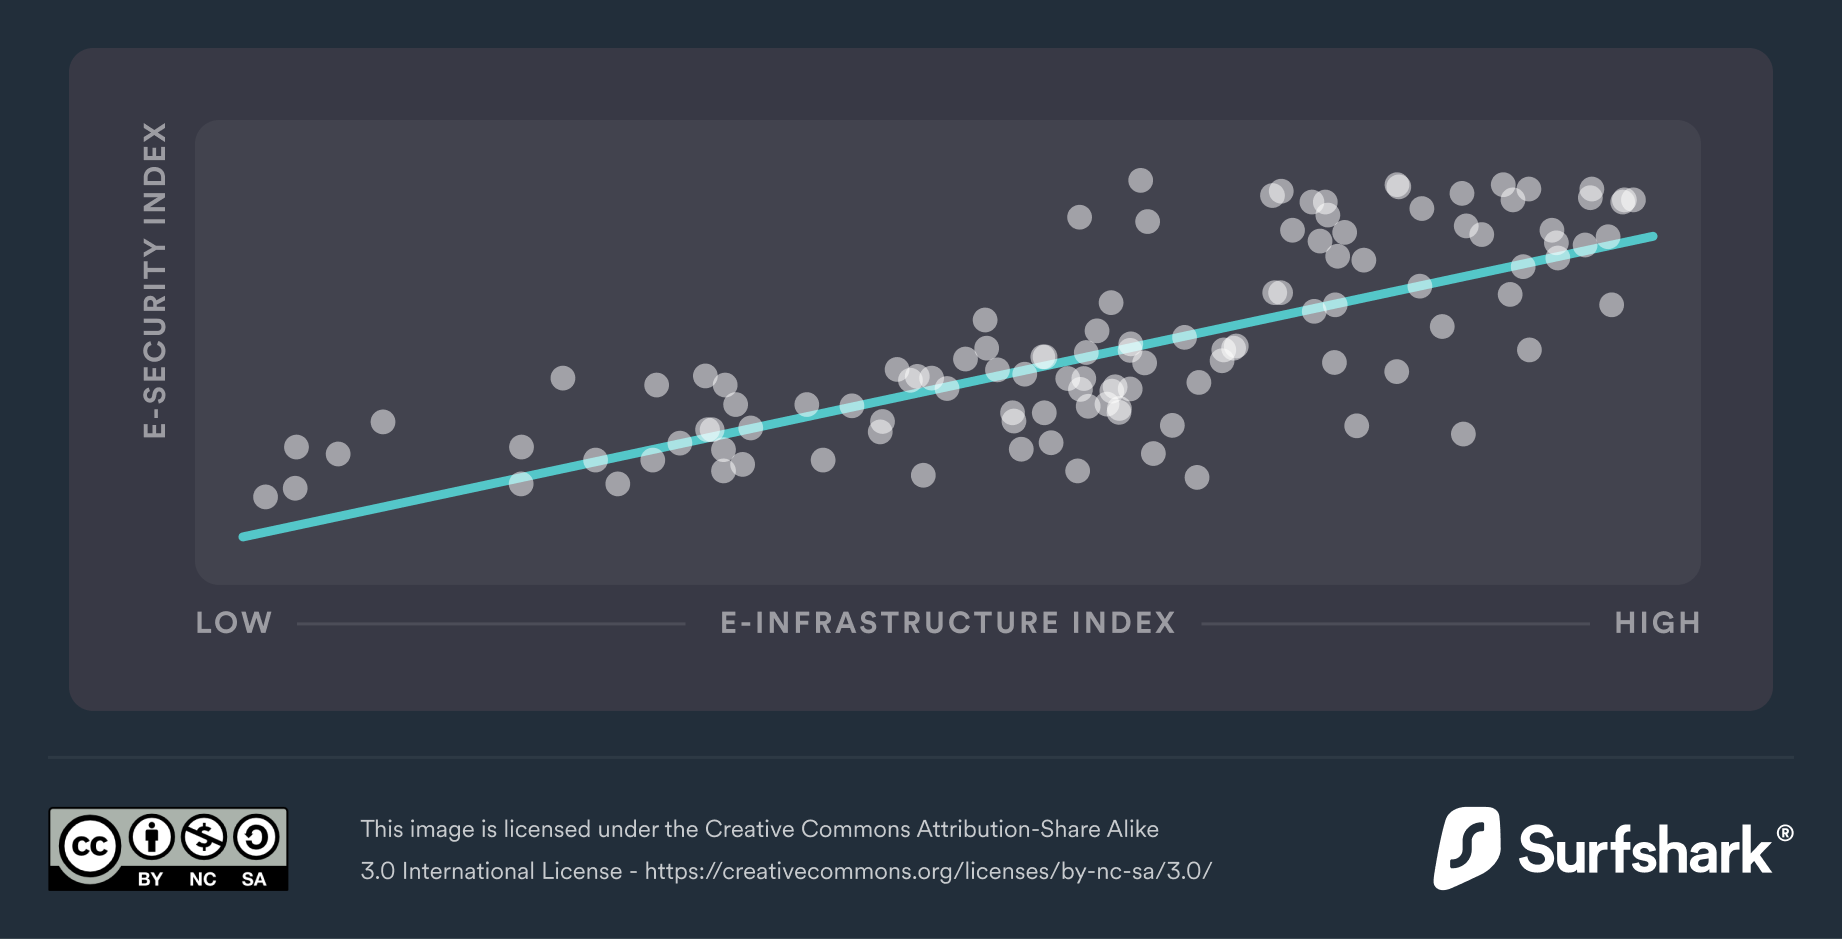
Countries with better e-infrastructure are more equipped to prevent cyber threats and incidents
Countries with higher e-infrastructure can further strengthen their cybersecurity (correlation 0.76) than countries with poorer e-infrastructure.

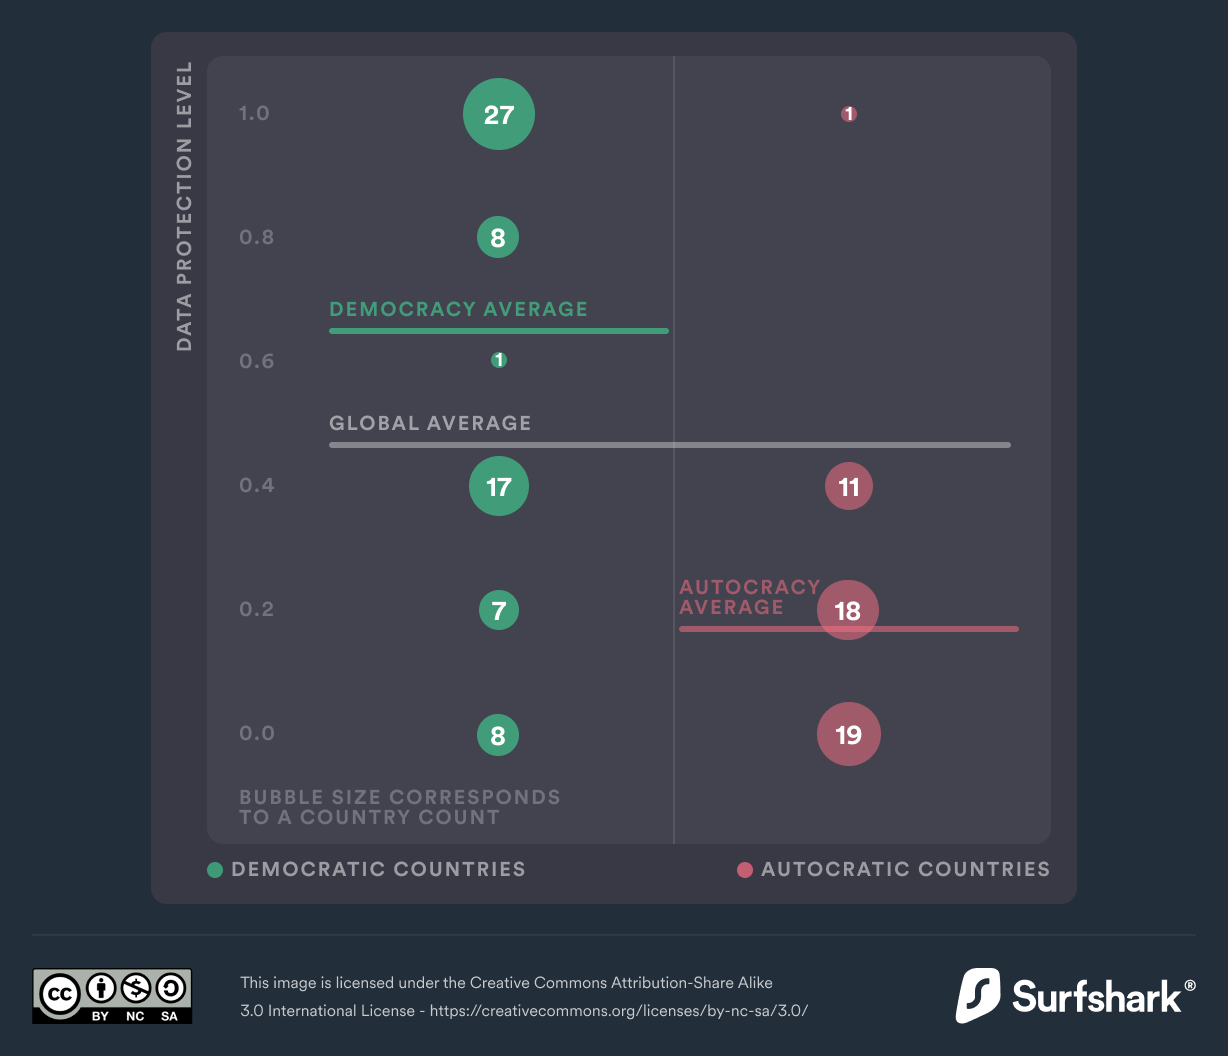
Autocratic countries don't show any intentions to protect their citizens' data
- Only 2% of the analyzed autocratic countries have data protection levels higher than the global average (0.44).
- Democratic countries have better than average global data protection levels (53%).
- Democratic countries hold 0.62 in data protection levels while autocratic countries rank two times lower than the global average with 0.18.

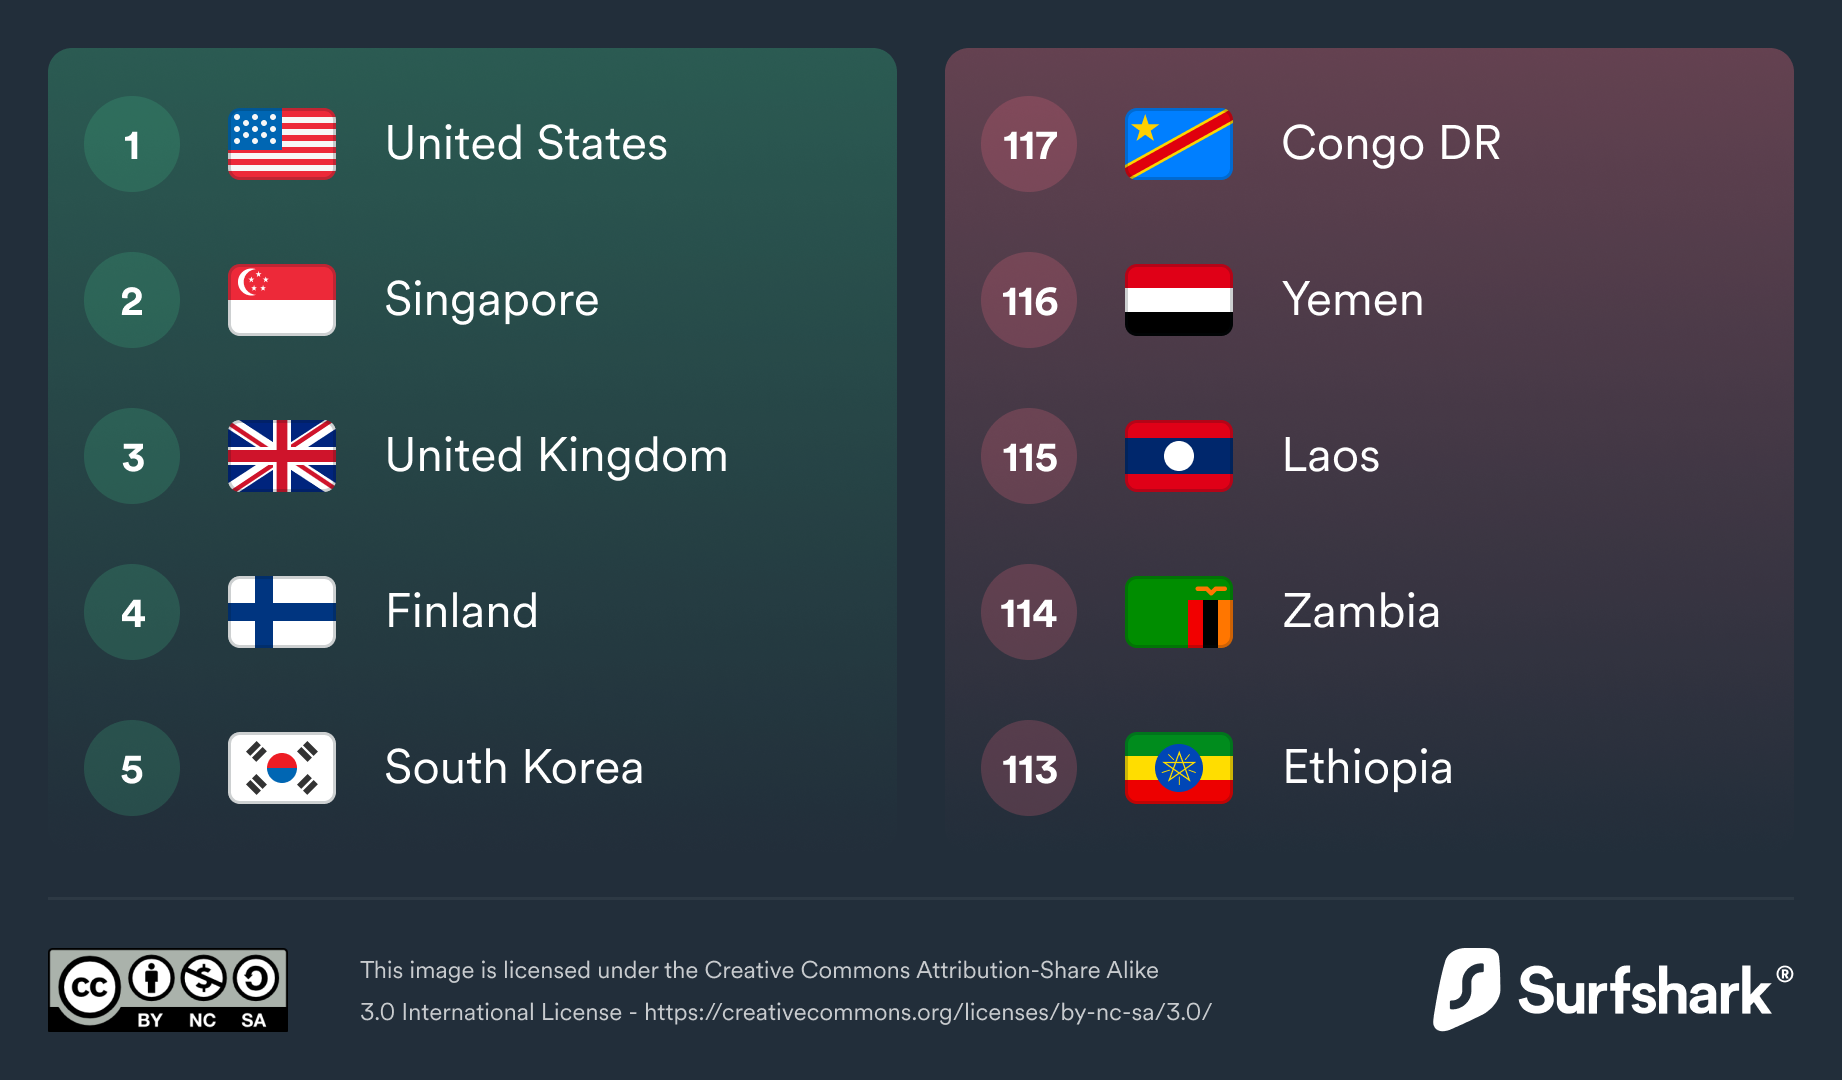
Electronic government key insights
Online services index + AI readiness index
Most and least developed e-government
- United States
- Singapore
- United Kingdom
- Finland
- South Korea
- Congo DR
- Yemen
- Laos
- Zambia
- Ethiopia
Countries with the highest readiness to adopt AI technology are also ready to counter national cyber threats
18 of the top 20 countries in AI readiness criteria also have a better than average cybersecurity index. The two exceptions here are China and the U.A.E.:
- The United Arab Emirates provides no data protection to its citizens, which increases the risk of violating personal privacy. The country also falls short in managing digital threats, according to the National Cyber Security Network.
- China, compared to last year, has improved its National Cybersecurity Index, but still falls short in cybersecurity due to poor cybercrime prevention and a lack of cybersecurity policy development.
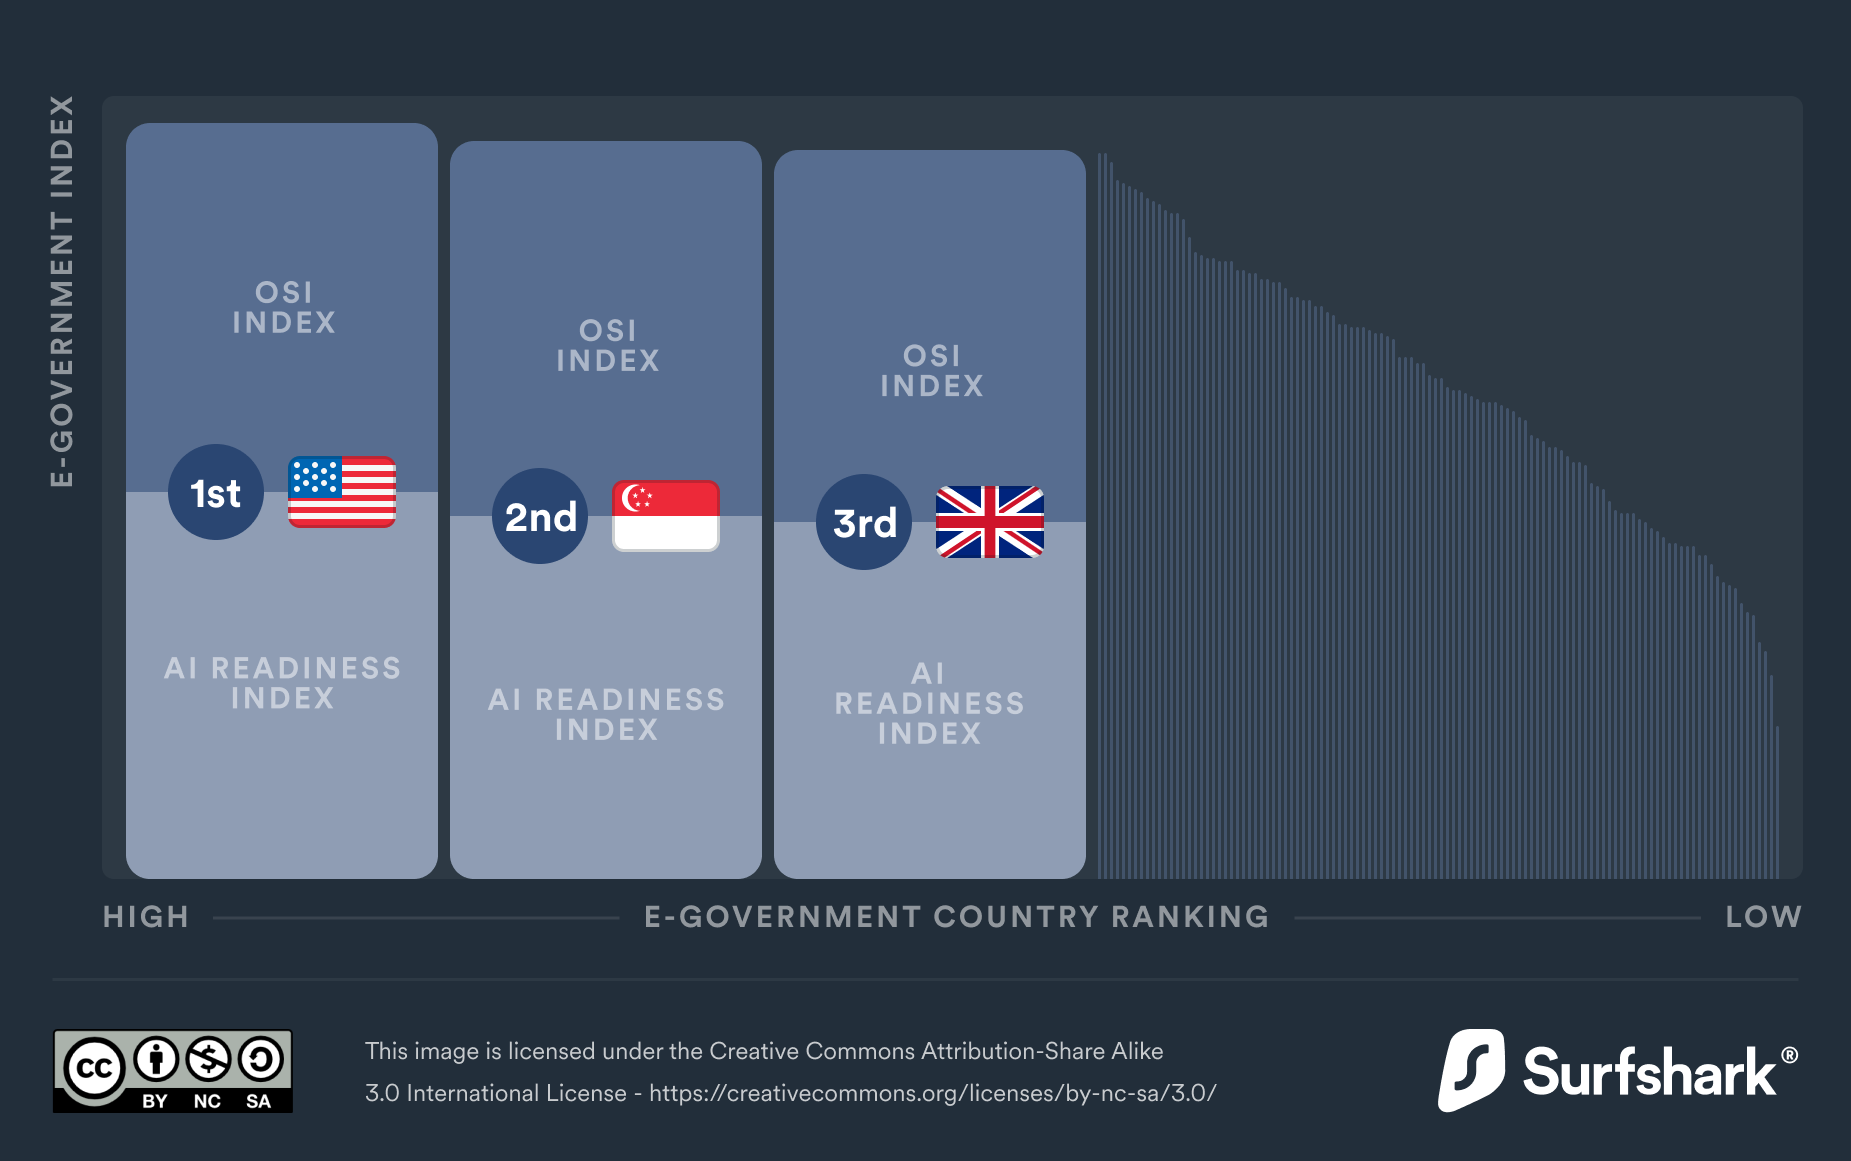
The US, Singapore, and the UK have the most advanced electronic government due to an especially high level of AI readiness
The US leads the e-government pillar for a second year running, while the UK lost its second place position to Singapore. Singapore jumped up 3 places in the e-government pillar by improving its readiness to implement AI in the public services sector.

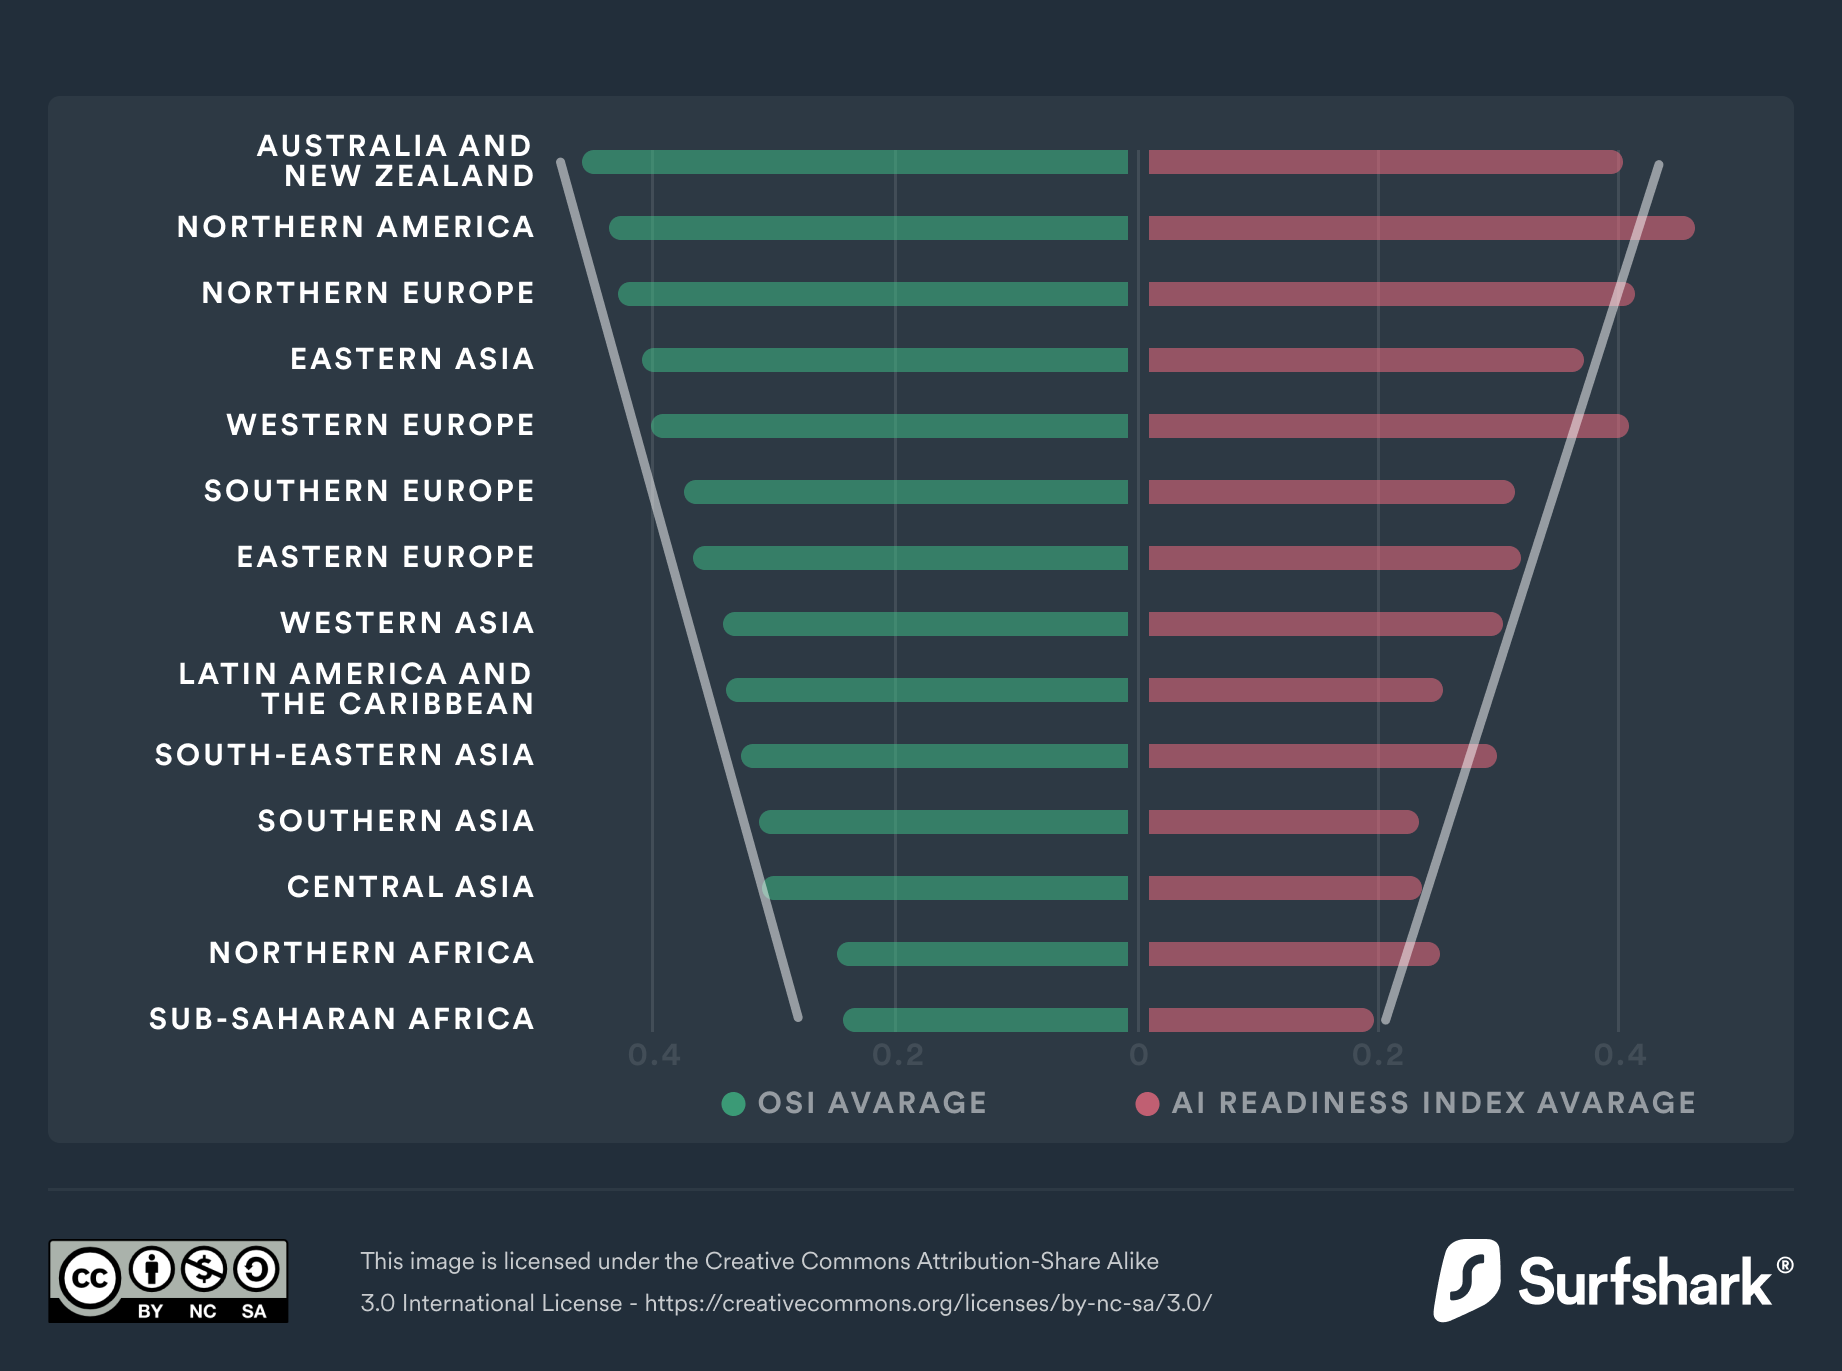
Governments with established, easily accessible online services are better prepared to implement AI in the public services sector
There is a strong correlation (0.92) between regional averages for Online Service and AI Readiness indices. Overall, Northern America leads in the e-government pillar with a 43% higher regional index than the average value (0.64).

Back
Global rank
Global ranking out of 117 countries
Ranking index
Rank in
n/a
First time ranked
DQL rank jumped up
DQL rank dropped down
DQL rank not changed
Compared to 2021
2021
2022
Place change since 2021
Internet Affordability
rank / index
/
/
Time to work to afford the cheapest mobile internet
rank / seconds
/
/
Time to work to afford the cheapest broadband internet
rank / minutes
/
/
Internet Quality
rank / index
/
/
Mobile speed
rank / Mbps
/
/
Broadband speed
rank / Mbps
/
/
Mobile internet stability
rank / index
/
/
Broadband internet stability
rank / index
/
/
Mobile speed improvement
rank / index
/
/
Broadband speed improvement
rank / index
/
/
Electronic Infrastructure
rank / index
/
/
Individuals using the internet
rank / per 100 inhabitants
/
/
Network readiness
rank / index
/
/
Electronic Security
rank / index
/
/
Cybersecurity
rank / index
/
/
Data protection laws
rank / score
/
/
Electronic Government
rank / index
/
/
Online Service Index
rank / index
/
/
AI readiness
rank / index
/
/